Deciding whether to use an active or passive vehicle for the different allocations within an investment portfolio is an important decision for investors. It can have a significant impact on a portfolio’s risk/return profile and on the long-term investment outcomes from an absolute and relative standpoint. While the active/passive issue has been covered across many asset classes, this article will explore the topic specifically for listed real estate funds, both Australian, or AREITs, and global, or GREITs, focused strategies.
What does empirical data tell investors about active and passive REIT performance?
Exhibit 1 below is a snapshot from Morningstar's Active Passive Barometer. It shows that the average total return of both active AREIT and GREIT managers was less than passive strategies on a trailing 10-year time frame to June 2023. Many active managers across both categories failed to outperform the average total return of passive strategies over the same period, with survivorship and merged funds considered. It's important to note that the sample size of both categories is relatively small: AREITs had 27 active and seven passive strategies, while GREITs had 16 active and five passive strategies.
Exhibit 1 Morningstar Active Passive Barometer Annualized 10-Year Trailing Return
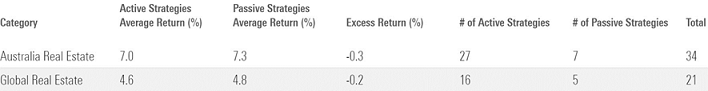
Source: Morningstar. Data as of June 30, 2023.
On the surface, the average underperformance of active strategies relative to passive strategies in both categories is a disappointing result for investors. Particularly given that they are paying active management fees and expect some level of outperformance over a reference index or passive strategy that aims to track a benchmark in the long term. But as we delve deeper into these simple average figures, we see that it's not all bad news.
Looking beyond the simple average
Exhibit 2 below shows the number and percent of active strategies that have outperformed the average total return of passive strategies in their respective category over the last decade to June 2023.
Exhibit 2 Morningstar Active Passive Barometer Over 10 Years

Source: Morningstar. Data as of June 30, 2023.
It was a respectable result in the AREIT category, with 12 out of 27 (around 44%) active strategies delivering a positive excess return relative to the average total return of passive strategies. Excess return is simply calculated by subtracting the total return of an active strategy from the cumulative average total return of passive strategies in a category over a specified time frame. On an annualized basis, the top-performing active AREIT strategy returned 8.8% and the lowest returned 4.6%, while the best-performing passive strategy returned 7.7% and the worst returned 6.4%, as shown in Exhibit 3. Despite the wide range between the upper and lower bands in the category, the variability in returns was relatively low. Passive strategies in the category track the highly concentrated S&P/ASX 300 or 200 AREIT indexes. A reminder that Morningstar has written about the concentration risk associated with these indexes in the past, which remains true at the time of writing. Many active AREIT managers address this risk and the limited opportunity set by allowing a portion of their portfolio to be invested in offshore, non-index and/or smaller domestic stocks.
Exhibit 3 Annualized 10-Year Total Return (%) of Active AREIT Strategies
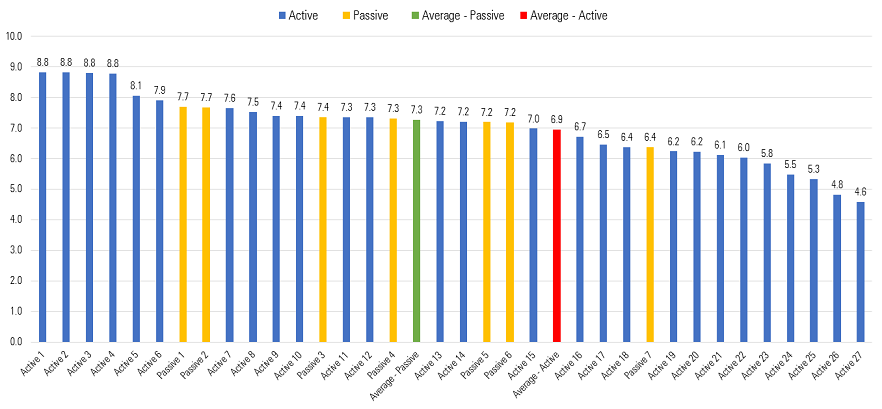
Source: Morningstar. Data as of June 30, 2023.
On the other hand, a disappointing four out of 16 (25%) active GREIT strategies only managed to beat the average total return of passive strategies. The diversity of real estate subsectors within the index has proven to be a challenge for most active managers to beat, despite U.S. domiciled REITs and stocks accounting for more than half of the FTSE EPRA Nareit Developed Index over the last decade.
On an annualized basis, the best-performing active strategy returned 7.3% and the lowest returned 3.2%, while the best-performing passive strategy returned 6.7% and the worst returned 2.7%. The variability in returns was also fairly low in the GREIT category, as seen in Exhibit 4, although the difference between the upper and lower bands was wider compared with the AREIT category.
One factor driving this and a critical point to note, is that the category consists of currency-hedged, unhedged, active, and passive vehicles because of the small number of available GREIT strategies. Foreign currency performance relative to the Australian dollar, but mainly the United States dollar, has had a sizable impact on performance over the 10-year time frame to June 2023, with the AUD depreciating relative to the USD over this period. It's also crucial to point out that not all passive GREIT strategies in the category track the FTSE EPRA Nareit Developed Hedged AUD Index, which is the benchmark assigned as the Morningstar Category Index. There are several passive strategies that track an iteration of the core index, the FTSE EPRA/NAREIT Developed ex Australia Rental Index.
Exhibit 4 Annualized 10-Year Total Return (%) of Active GREIT Strategies
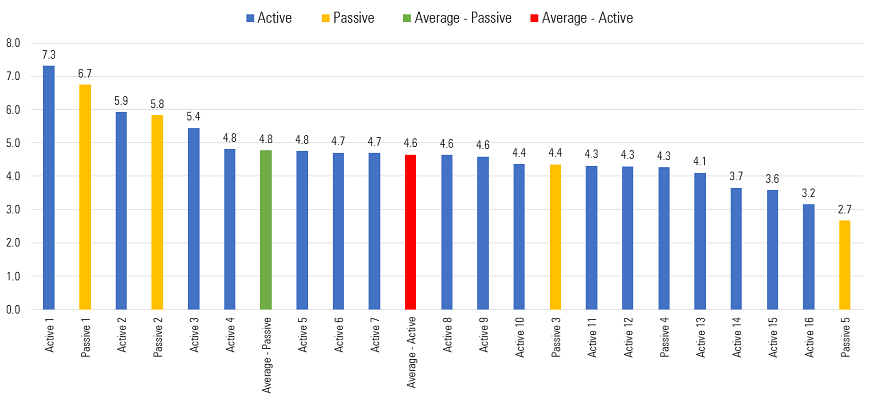
Source: Morningstar. Data as of June 30, 2023.
Having said all that, it's vital for investors to be aware of the inherent risks in the real estate sector, such as interest-rate risk and susceptibility to broader economic activities, to name a few. It's also paramount to be mindful that passive strategies are generally not designed to offer downside protection when the relevant sector and/or broader markets are falling. In that type of environment, active strategies may be better designed to protect capital, like some skilled active managers demonstrated during the sector (and market) drawdowns of 2020 and 2022.
Notwithstanding the highlighted underperformance of most active strategies across both categories, Morningstar understands that some investors may still have a preference to use an active strategy over a passive one for their portfolio's listed real estate allocation.
Morningstar's Top-Performing Analyst-Rated Strategies
Exhibit 5 below lists the top-three-performing active and passive AREIT strategies over the last decade to June 2023 that have a Morningstar Medalist Rating of Bronze or above, as well as Morningstar's view on fully analyst-covered strategies.
Resolution Capital Real Assets topped the active list followed by Ironbark Paladin Property Securities and Pendal Property Investment.
In the passive space, the top three strategies from highest to lowest were Silver-rated Macquarie True Index Listed Property, Gold-rated Vanguard Australian Property Securities, and Silver-rated SPDR S&P/ASX 200 Listed Property.
Exhibit 5 Top-Three Performing Active and Passive AREIT Strategies Over the Last Decade
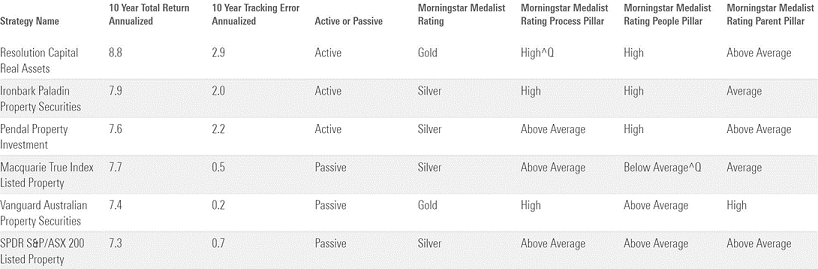
Source: Morningstar. Data as of June 30, 2023.
Exhibit 6 below shows the top-performing active hedged, active unhedged, and passive GREIT strategies over the last decade to June 2023 that have a Morningstar Medalist Rating of Bronze or above, as well as Morningstar's view on fully analyst-covered strategies. There were only two unhedged strategies because of the criteria and size of the category. It's also worth reiterating that the global real estate category contains currency-hedged and unhedged vehicles, and not all passive strategies in the category track the AUD-hedged version of the FTSE EPRA Nareit Developed Index (the Morningstar Category Index).
Starting with hedged vehicles, Resolution Capital Global Property Securities' hedged vehicle took first position followed by UBS CBRE Global Property Securities and Principal Global Property Securities.
From an unhedged perspective, Resolution Capital Global Property Securities' unhedged vehicle claimed the top spot, while Dimensional Global Real Estate occupied second place.
In terms of passive strategies, Macquarie True Index Global Real Estate Securities' unhedged vehicle achieved top position.
Exhibit 6 Top-Performing Active Hedged, Active Unhedged, and P Over the Last Decade to June 2023
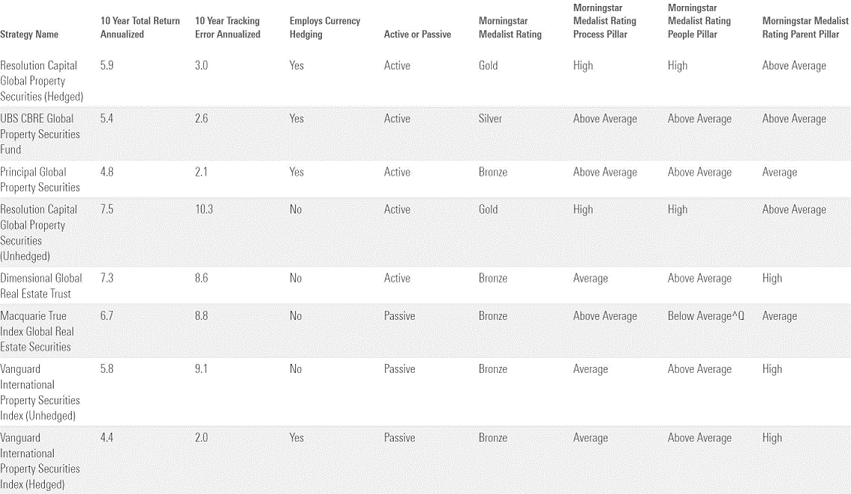
Source: Morningstar. Data as of June 30, 2023.
The bottom line
Historical data based on simple average returns indicates that passive strategies have outperformed active strategies in both the AREIT and GREIT categories in the long term. At face value, this makes somewhat of a compelling case for passive strategies over active strategies within an investor's portfolio allocation to listed real estate. Regardless of this, Morningstar's Manager Research believes that certain active strategies, including the ones highlighted above, have the potential to outperform their passive counterparts. However, the allocation decision to use an active or passive strategy ultimately sits with the end investor. Given the complexity involved with this matter, investors should seek professional financial advice for assistance if required.
Steven Le is a Morningstar Manager Research Analyst. This article is general information and does not consider the circumstances of any investor. Please consult a financial adviser before making investment decisions. This article was originally published by Morningstar.
This article was originally published by Morningstar.
Access data and research on over 40,000 securities through Morningstar Investor, as well as a portfolio manager integrated with Australia’s leading portfolio tracking service, Sharesight. Sign up to a free trial below:
Try Morningstar Investor for free