As investors navigate a potential recession and the possibility of higher interest rates for longer, the lure of fixed income is understandable. Government bond prices typically appreciate as economies enter recession, which could help offset losses that may occur in other parts of a portfolio – namely equities (as earnings decline) and real estate (as home prices depreciate) – making bonds a key element of a balanced portfolio.
According to Reuters, Australia’s $1.5 trillion in pension assets (as part of the $3.5 trillion superannuation sector) has increased its investments in local and foreign debt “by more than $20 billion over the past year as higher yields burnished an asset class overlooked in a country where equities traditionally rule.”
AustralianSuper told Reuters it had doubled debt assets to $40 billion over the past year while Australian Retirement Trust, which manages $240 billion, lifted its fixed income allocation to 13.7% from 12.5%, according to filings.
Fixed income exchange traded products (ETPs) have continued to increase in popularity with the industry growing to $23.4 billion from $16.2 billion in 2022 in Australia. In 2023, fixed income strategies have taken the lion’s share of ETP flows.
Using fixed income to play the yield curve
One way fixed income investors can add relative value to their bond portfolio is to ‘play’ the yield curve. The yield curve is a line that plots the yields of Australian Government Bonds (AGBs) with differing maturity dates.
Chart 1: The Australian Government Bond yield curve
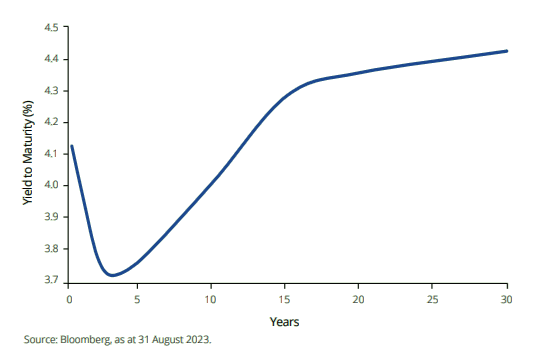
The slope of the yield curve reflects the difference between yields on short-term bonds and long-term bonds. The yields on short- and long-term bonds can be different because investors have expectations, which are uncertain, that the cash rate in the future might differ from the cash rate today.
For example, the yield on a 10-year bond reflects investors' expectations for the cash rate over the next 10 years, along with the uncertainty associated with this. Because longer-term yields are more difficult to predict, their yields tend to move more than shorter-term bonds.
The yield curve is an important economic indicator because it is a source of information about investors' expectations for future interest rates, economic growth, and inflation.
It is therefore possible for investors to take a view of the slope of the curve and position their portfolios for this.
Different yields curves and what they mean
There are several scenarios that cater for a bond portfolio exposure to be either overweight or underweight the short, medium or long end of the yield curve. For example, if an investor thinks interest rates will rise, they might shorten the duration of their portfolio by using a shorter-term bond such as a 1-5 year to reduce duration risk.
On the flip side if an investor thinks interest rates have peaked, they could invest in Australian government bonds that have longer maturity dates, for example 10 years plus. The longer the duration the more bond prices increase when interest rates fall.
A ‘normal’ yield curve is upward sloping where short-term yields are lower than long-term yields. Typically, this type of yield curve is seen during periods of economic expansion. In this environment, investors demand higher yields on longer-term bonds as compensation for inflation and future rate rises.
Chart 2: Normal Yield Curve
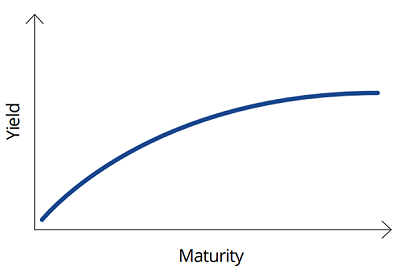
Source: VanEck. For illustrative purposes.
So, in the event bond markets forebode economic conditions and interest rates deteriorate, the long end of the curve typically decreases, resulting in a ‘flattening’ of the curve.
Chart 3: Normal to flat yield curve
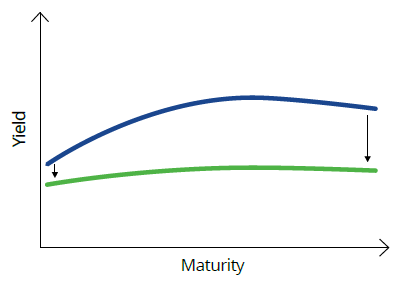
Source: VanEck. For illustrative purposes.
A more exceptional scenario is where bond markets forecast the economy to enter a recession or slowdown, such that the yield curve inverts where short-dated yields are higher than long-dated. In the US, when this happens it is often a leading indicator of an impending recession. At the least, an inverted curve may indicate that economic growth is going to slow and that central banks will need to cut rates in the near term to stimulate economic growth.
Chart 4: Inverted yield curve
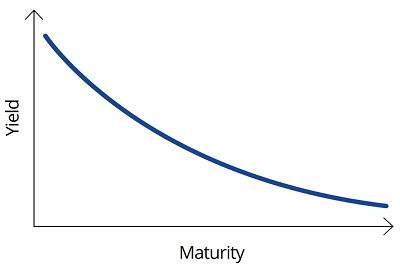
Source: VanEck. For illustrative purposes.
In both scenarios, investors with long-dated yield exposure benefit from bond price increases as yields fall. Investing in long-dated bonds is considered a defensive strategy as prices typically increase when forecast economic conditions deteriorate.
In another scenario, the yield curve can steepen at the long end, higher than it does at the short end is known as a 'bear steepen'. Bear, because rises in yields are bad, or ‘bearish’, for bonds. Typically, this type of yield curve movement is associated with an environment in which investors think interest rates and economic activity are expected to rise. Shortest duration exposure is preferred here, to minimise the negative impact of rising yields on bond prices.
Chart 5: Normal to bear steepen
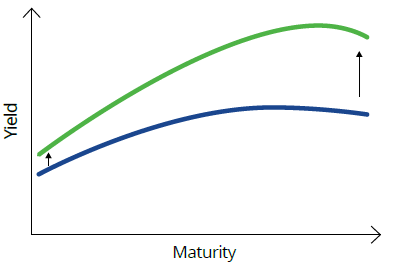
Source: VanEck. For illustrative purposes.
Sometimes yields fall, but short-term yields by more than long-term yields. This may occur in a falling-rate environment where the market thinks there will be near-term rate cuts and they will be few or temporary. The jargon for this is a ‘bull steepen’ (bull – because falls in yields are good, or bullish, for bonds). Exposure to the short and middle parts of the curves is preferred to benefit more from the impact of falling yields on bond prices.
Chart 6: Normal curve to bull steepens
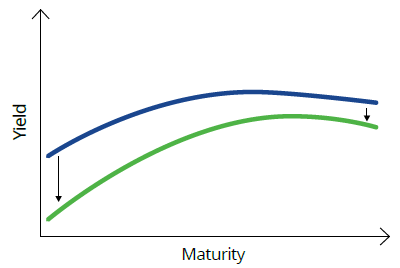
Source: VanEck. For illustrative purposes
Cameron McCormack is a Portfolio Manager at VanEck Investments Limited, a sponsor of Firstlinks. This is general information only and does not take into account any person’s financial objectives, situation or needs. Any views expressed are opinions of the author at the time of writing and is not a recommendation to act. For more insights on bonds, visit: vaneck.com.au/blog/income-investing/.
For more articles and papers from VanEck, click here.