Register For Our Mailing List

Register to receive our free weekly newsletter including editorials.

Home / 578

The butterfly effect, index funds, and the rise of mega caps

What goes up must come down was the mantra of small-cap investors for decades. Yet, over the last 10 to 20 years the largest companies have become larger and larger, outperforming small caps in the process. Some new research indicates that at least in part, this might not have been the result of mega caps being operationally superior to small caps but may be due to a butterfly effect triggered by index fund flows.

Index funds have long been prime suspects in the search for reasons why large companies have grown larger over time and why the US stock market, for example, is entirely dominated by a few mega-cap tech companies. I have always been suspicious of this argument because if you buy an index tracker, you buy each stock in the index in proportion to their market cap, so investors moving from active to passive funds should not influence the relative market cap of the stocks in an index.

Yes, index investors don’t correct mispricing of stocks because they don’t care about valuations, but the stock market remains dominated by active investors, and the market share of index trackers is in my view way too small to explain why megacap stocks trade at much higher valuations than most of the rest of the S&P 500, for example.

But when I read a paper by Hao Jiang, Dimitri Vayanos, and Lu Zheng I was surprised to see how flows into index funds create a butterfly effect among large-cap stocks.

For the uninitiated, the butterfly effect describes the observation that in a complex nonlinear system, even the tiniest changes in starting conditions can lead to large changes in the result. This was commonly described as a butterfly flapping its wings creating a tornado somewhere else.

The butterfly effect was discovered by meteorologist Edward Lorenz who tried to run computer forecasts of the weather. Below is a visualisation of the simple computer model he ran in 1972. The blue and yellow cones are virtually in the same spot at the start of the simulation. They differ only by 0.0001 units horizontally. For the first 23 seconds, the blue and yellow trajectories are the same, but then they start to diverge wildly. The centre cone in the chart below shows the position after 30 seconds.

The butterfly effect in the Lorenz attractor

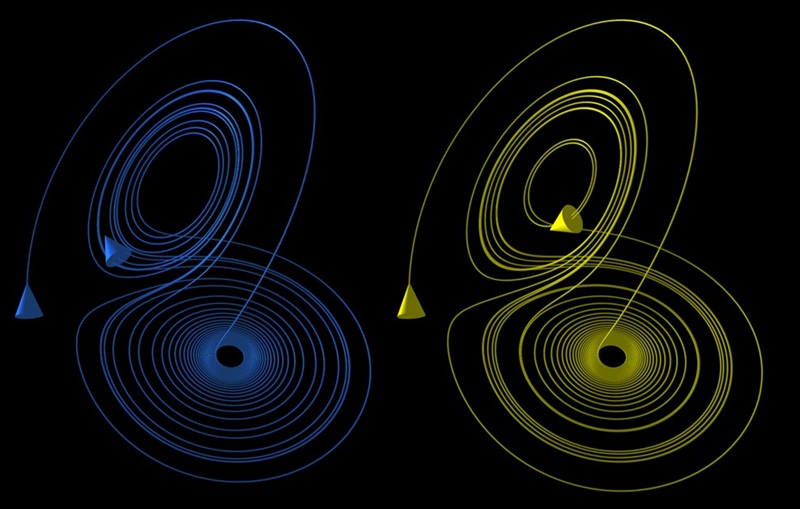
Source: XaoBits, Wikimedia Commons

In their research, Jiang et al. demonstrated something like a butterfly effect in US stock markets. Whenever index funds put money to work in the market, idiosyncratic volatility for larger stocks increased more than for small stocks, and excess returns over cash increased as well.

But index flows into the US stock market are tiny. Over the last 25 years, they average 0.05% of US stock market cap per quarter with a standard deviation of 0.09% per quarter. Annualised, we are talking about 0.2% of market cap shifting from active to passive management per year.

They show that while the impact on the relative market cap of the largest stocks in the US is a tiny 0.3% per quarter, this accumulates over time. After 25 years these tiny shifts in market cap between larger and smaller stocks amount to large-cap stocks being 30.25% larger than they would have been without the rise of index investments!

But why would the market cap of large stocks in an index react more than the market cap of smaller stocks? This is where Valentin Haddad, Paul Hübner, and Erik Loualiche provide a fascinating answer. They measure the price elasticity of stocks to changes in flows for each stock in the US. They find that the larger a company, the more inelastic demand becomes. But when demand is inelastic it means that a small increase in demand leads to a larger increase in price (and hence market cap).

The reason why demand becomes more inelastic for larger stocks is simply because almost every investor – whether active or passive – needs to own the largest companies in a market. If you own smaller companies, you can easily sell them when they become too expensive and in your view overvalued.

If you are an active fund manager, nobody will blame you for underperformance just because you didn’t own Etsy shares. But try not owning NVIDIA or Apple shares and then underperform the market and see how your investors will react… Hence, even active investors are forced to hold at least some NVIDIA and Apple shares no matter how expensive they are. And that tiny difference in demand creates a huge benefit for the largest stocks over 25 years.

Elasticity of demand declines for larger stocks

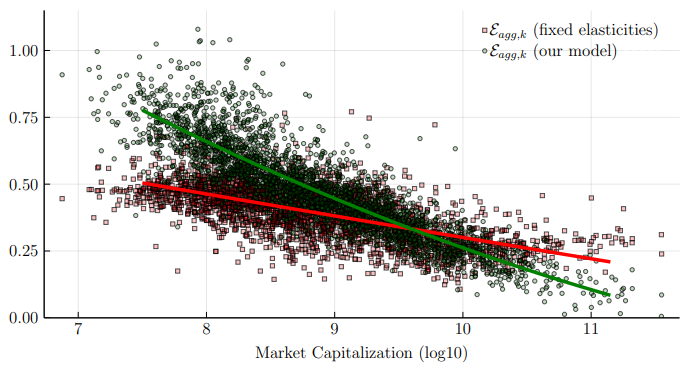
Source: Haddad et al. (2024)


Joachim Klement is an investment strategist based in London. This article contains the opinion of the author. As such, it should not be construed as investment advice, nor do the opinions expressed necessarily reflect the views of the author’s employer. Republished with permission from Klement on Investing.


RELATED ARTICLES

Index versus active – our readers reprise

Index versus active? Nobel Prize professors can’t agree

banner

Most viewed in recent weeks

Raising the GST to 15%

Treasurer Jim Chalmers aims to tackle tax reform but faces challenges. Previous reviews struggled due to political sensitivities, highlighting the need for comprehensive and politically feasible change.

7 examples of how the new super tax will be calculated

You've no doubt heard about Division 296. These case studies show what people at various levels above the $3 million threshold might need to pay the ATO, with examples ranging from under $500 to more than $35,000.

Are franking credits hurting Australia’s economy?

Business investment and per capita GDP have languished over the past decade and the Labor Government is conducting inquiries to find out why. Franking credits should be part of the debate about our stalling economy.

Here's what should replace the $3 million super tax

With Div. 296 looming, is there a smarter way to tax superannuation? This proposes a fairer, income-linked alternative that respects compounding, ensures predictability, and avoids taxing unrealised capital gains. 

The rubbery numbers behind super tax concessions

In selling the super tax, Labor has repeated Treasury claims of there being $50 billion in super tax concessions annually, mostly flowing to high-income earners. This figure is vastly overstated.

9 winning investment strategies

There are many ways to invest in stocks, but some strategies are more effective than others. Here are nine tried and tested investment approaches - choosing one of these can improve your chances of reaching your financial goals.

Latest Updates

Taxation

100 Aussies: seven charts on who earns, pays, and owns

The Labor government is talking up tax reform to lift Australia’s ailing economic growth. Before any changes are made, it’s important to know who pays tax, who owns assets, and how much people have in their super for retirement.

7 key charts on the state of the Australian property market

The Australian property market stirs fierce debate - often bullish optimism versus crash predictions. But beyond the noise, seven charts reveal what's really driving prices and the outlook moving forward.

A simple alternative to the $3 million super tax

Division 296 aims to introduce improved fairness into the superannuation system, yet is overly complex. This scours the world for better ideas and suggests a simpler alternative which can achieve the same goals.

CBA and the index conundrum for super funds

After the hyperbolic rise in CBA shares, super funds are floating the idea of carving out the weightings of ASX bank securities and indexing them within their portfolios. This looks at why that might be a big error.

Strategy

10 policies to drive Australian productivity higher

Here's a comprehensive list of proposed reforms to fix Australia's stagnating economy, including introducing a flat income tax rate, reducing migration, and making childcare tax-deductible.

Interviews

Where to find big winners in Asia

As more money looks for a home outside the US, Asia may soon get some love. Fidelity's Anthony Srom outlines the best places in Asia to invest, including in Chinese consumer names, Indian financials, and Thailand.

Investment strategies

We have trouble understanding the time value of money

We overvalue the present and underestimate the future - it’s a cognitive glitch called hyperbolic discounting. It affects savings, spending, and loans, and it's more common - and costly - than we think. 

Sponsors

Alliances

© 2025 Morningstar, Inc. All rights reserved.

Disclaimer
The data, research and opinions provided here are for information purposes; are not an offer to buy or sell a security; and are not warranted to be correct, complete or accurate. Morningstar, its affiliates, and third-party content providers are not responsible for any investment decisions, damages or losses resulting from, or related to, the data and analyses or their use. To the extent any content is general advice, it has been prepared for clients of Morningstar Australasia Pty Ltd (ABN: 95 090 665 544, AFSL: 240892), without reference to your financial objectives, situation or needs. For more information refer to our Financial Services Guide. You should consider the advice in light of these matters and if applicable, the relevant Product Disclosure Statement before making any decision to invest. Past performance does not necessarily indicate a financial product’s future performance. To obtain advice tailored to your situation, contact a professional financial adviser. Articles are current as at date of publication.
This website contains information and opinions provided by third parties. Inclusion of this information does not necessarily represent Morningstar’s positions, strategies or opinions and should not be considered an endorsement by Morningstar.