The long-anticipated fall in US share markets and return of volatility finally arrived this week, with the S&P 500 down 4.1% on Monday 5 February 2018 after a 2% fall the previous Friday. Following this lead, the S&P/ASX200 fell 2% then 3.5%, and the headlines screamed of panic selling and a wipe out of billions of dollars of wealth.
But these movements always require a context. The S&P 500 was up 5.6% in January 2018 alone, hitting all-time highs. Long-term investment plans should expect stock markets to move like this regularly.
What matters more is where the market is headed for the long term, and whether it offers value compared with historical levels.
Two weeks ago, Robert Shiller, 2013 Nobel laureate in Economic Sciences, and co-inventor of the CAPE measure, was calling the US the “world’s priciest stock market” because the CAPE ratio was higher than every other country measured.
Development of the CAPE ratio
Thirty years ago, in February 1988, Robert Shiller and John Campbell presented a paper to NBER (National Bureau of Economic Research) that led to the cyclically-adjusted price-to-earnings (CAPE) ratio. The CAPE ratio is the real (inflation-adjusted) price of a share divided by a ten-year average of real earnings per share. It's an alternative to the more common P/E ratio.
Why ten years? Says Shiller:
“Ownership of stock represents a long-term claim on a company’s earnings, which the company can pay to the owners of shares as dividends or reinvest to provide the shareholders more dividends in the future. A share in a company is not just a claim on next year’s earnings, or on earnings the year after that. Successful companies last for decades, even centuries.”
Earnings can be volatile from year to year, but research indicates there is mean reversion in earnings, which means there’s value in using long-term averages.
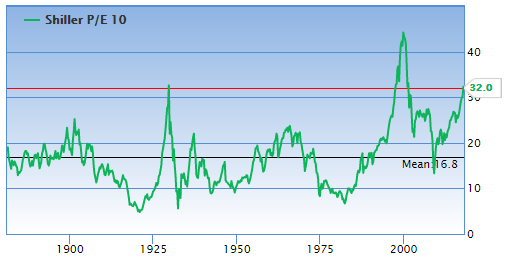
The CAPE ratio reached an all-time high during the dot-com bubble. It also reached a historically high level again during the GFC up to 2007. Today, Barclays Bank in London compiles the CAPE ratios for 26 countries using Robert Shiller as a consultant.
As shown below, the historical mean of the CAPE for US markets is 16.8. At the close of 5 February, it stood at 32, or 90% higher (the regular P/E ratio has an historical mean of 16 and stood at 25).
Shiller and Campbell found that the lower the CAPE, the higher the investors' likely return from equities over the following 20 years. A comparison of CAPE values might assist in identifying the best markets for future equity returns.
Is the US market overpriced?
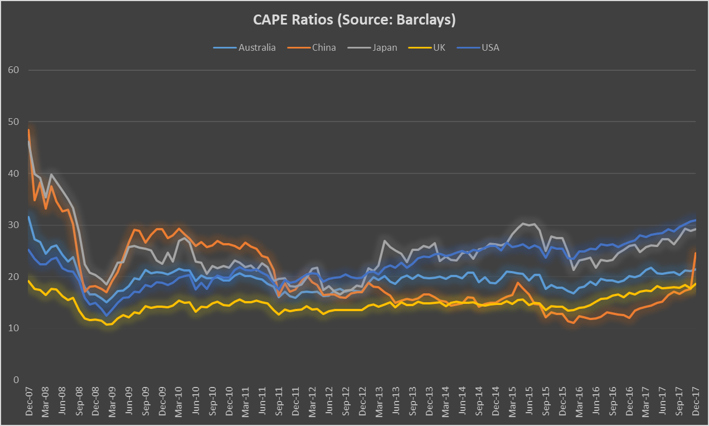
Two weeks ago, writing in Project Syndicate, Shiller expressed a concern that the CAPE ratio is at an historical high in the US and that it is higher than for any other country that it is measured for. At the end of 2017, the CAPE ratios for five major economies were: US 30.9, Australia 21.4, China 24.6, Japan 29.2, and UK 18.6.
While this might indicate some cause for concern, especially in the US, a high CAPE ratio need not mean that the market is necessarily overpriced.
Contrarian Geoffrey Caveney finds a reason for why the US CAPE ratio is now around its historic highs (it was only higher in the late 90s dot-com bubble):
“However, this is misleading right now because the CAPE ratio's 10-year back period begins with the Great Recession in 2007. So the 10-year earnings are abnormally low, due to the effect of 2007-2009 on the 10-year average. As the recession years ‘roll off’ the 10-year back period, the 10-year average earnings will increase, and stock prices can rise without making the Shiller CAPE ratio rise excessively.”
Diversify rather than justify
Even when using his own measure, Shiller cautions against being too sure of the reason it is high:
“… the mystery of what’s driving the US stock market higher than all others, [is] not the “Trump effect,” or the effect of the recent cut in the US corporate tax rate. After all, the US has pretty much had the world’s highest CAPE ratio ever since President Barack Obama’s second term began in 2013. Nor is extrapolation of rapid earnings growth a significant factor, given that the latest real earnings per share for the S&P index are only 6% above their peak about ten years earlier, before the 2008 financial crisis erupted.”
“The truth is that it is impossible to pin down the full cause of the high price of the US stock market. The lack of any clear justification for its high CAPE ratio should remind all investors of the importance of diversification, and that the overall US stock market should not be given too much weight in a portfolio.”
However, if US selloffs continue to be replicated in other markets, the US may retain its relative high, but hopefully not its historic high.
As tempting as it would be to justify investing against proven trends, country diversification could well be one simple response that is also prudent in a well-diversified portfolio.
(For an interactive analysis of CAPE ratios over time and for many countries, see this link).
Vinay Kolhatkar is Assistant Editor at Cuffelinks. This article is general information and does not consider the circumstances of any investor.