The role of an asset allocator is to draw on macro indicators to understand trends, draw conclusions and then suggest the appropriate exposure to different assets based on the investor’s needs or risk profile.
In this article, I present a range of macro charts and draw conclusions from these for different asset classes. Specifically, I review the outlook for bonds and explain why that market is in a state of flux and how central banks are manipulating the bond market. I will conclude with my outlook for cash rates under the direction of central banks across the world.
Bank profitability and dividends look secure
My first charts provide an insight into the analytical process for the Australian banking sector. These charts, created 2 years ago, anticipated the expiry of fixed loan mortgages and the projected increase in interest payments on mortgages through 2023.
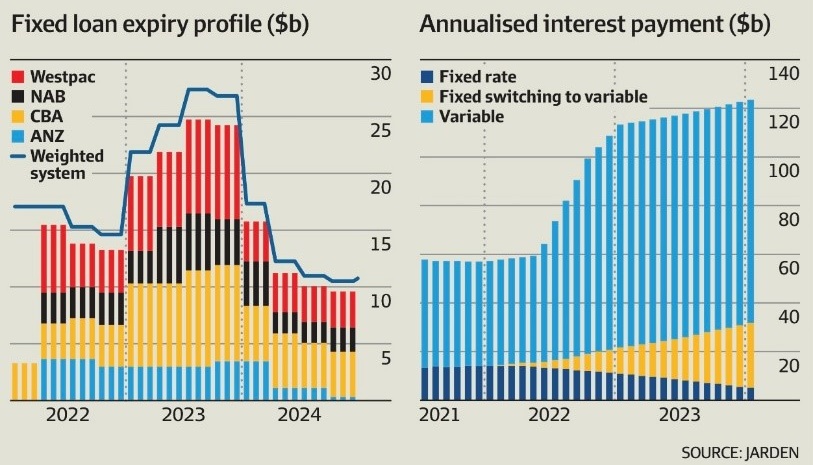
Through 2023, the charts were presented as a primary reason why investors needed to be cautious when investing in banks. Many fixed rate mortgage loans were written for 2-3-year terms at yields of 2-3% during the Covid period, and a ‘mortgage cliff’ loomed ahead. These loans were set at low rates because the RBA had given forward guidance of near zero interest rate settings through to 2024 (now) and provided loans (funding) to the banks at virtually no cost. The RBA also undertook Australia’s largest quantitative easing (QE) program (about $300 billion) as it drove down interest rates.
Today, most of the 2020 to 2022 fixed rate mortgage loans have been rolled into much higher interest rates. Whilst this has caused immense pressure for borrowed households, the Australian and the world economy has avoided recession, job markets have stayed strong, and loans remain well serviced. The worst of the debt rollover is over but pain for the borrowed household sector persists (I’ll return to this later).
Importantly, the ‘share of market’ chart of fixed loan mortgages (above on right) gave banking analysts and investors an important insight. The chart shows that Westpac and the Commonwealth Bank were the most exposed to the reset of fixed rate mortgages. Indeed, given their relative sizes, Westpac had the biggest relative market exposure - suggesting that it had been aggressive in writing fixed rate loans during the Covid period.
The chart helps explain why Westpac was marked down relative to its peers over 2023 and why it has (now) bounced back strongly (relatively outperformed) in recent months. The market perceived excessive risk in the Westpac balance sheet (loan book) that has now subsided. Indeed, the whole banking sector has come through the fixed loan reset relatively unscathed. Westpac shareholders can breathe with a sense of relief.
The next charts are related to the above because they show the effects of the pandemic, inflation and rising mortgage rates on Australia’s savings ratio.
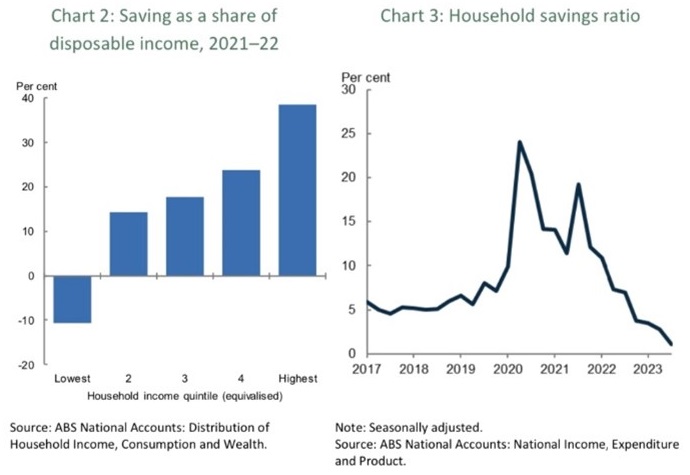
During the lockdown, savings ballooned because consumption was curtailed, and government cash payments flowed. Australia’s savings ratio reached historic highs in 2020 but is now racing towards historic lows. Over the long term, Australia’s savings rate has averaged around 5%.
The effect of inflation (mainly cost price driven) and higher interest rates is captured in the next chart. It shows that Australia’s real wages declined over the last two years following a sustained 10-year period (ex GFC) of real wage growth.
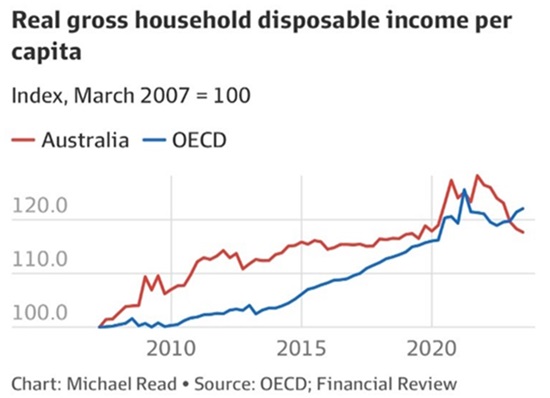
The decline in real wages, higher borrowing costs and cost push inflation (think power and petrol) has driven down the average household's real income and therefore consumed most of their discretionary consumption.
The points I draw from the above are these:
- Interest rates cannot rise much further (if at all) from current levels because the average household with a mortgage has a high level of financial stress.
- The above charts present the total position and are not segmented. Therefore, those with savings (self-funded retirees) are generally better off and those with borrowings worse off.
- The poor regulation of banks in the provision of mortgages – for instance, low deposit ratios and high loan to value lending – added to the housing price bubble. The government and regulators are now faced with a growing affordability problem caused by poor policy decisions.
- The real downturn in available discretionary expenditure has been offset by the immigration of about 800,000 people and returning students and tourists over the last two years.
- Banks will start to lend more to households with personal credit facilities (watch for a rise in credit card debt) that will increase margins so long as the borrowers remain employed.
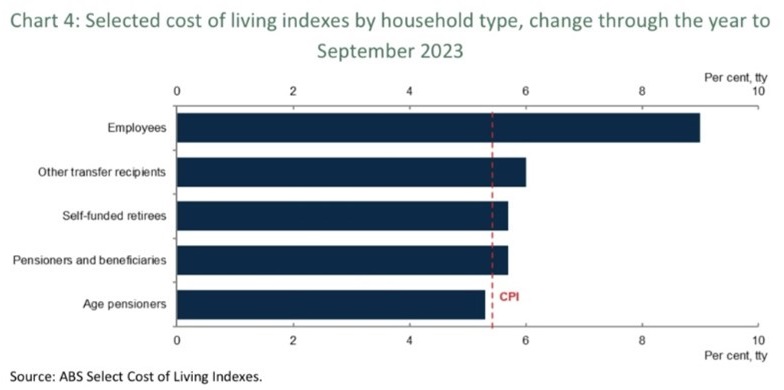
The bank sector benefits from growth in lending assets and more so in higher interest rate categories such as personal lending. Importantly, the adjustment to stage 3 tax cuts is directly targeted at that cohort of worker, which is either in, or moving towards, financial stress. The table below shows that it is the worker who has been most affected by cost-of-living increases.
The tax cuts are supportive of the banking sector although that is not the stated objective. In the main, the banks lend to working households; tax relief to them will help them draw and repay debt. Thus, bank profitability and dividends look secure and justify retention inside equity or income portfolios. Further, as noted above, Australian interest rates are very unlikely to be raised by the RBA and so fixed income investors can lock in rates.
Debt is a global problem – What does it mean for bonds as an asset class?
Whilst Australia has a significant household debt problem, the rest of the developed world has a significant government debt problem. This observation would normally lead to the view that bond interest rates should either rise or remain elevated based on the excessive supply of bonds over potential demand.
The next chart shows the level of government debt across the developed world, but it leaves out Japan whose net government debt exceeds 250% of GDP.
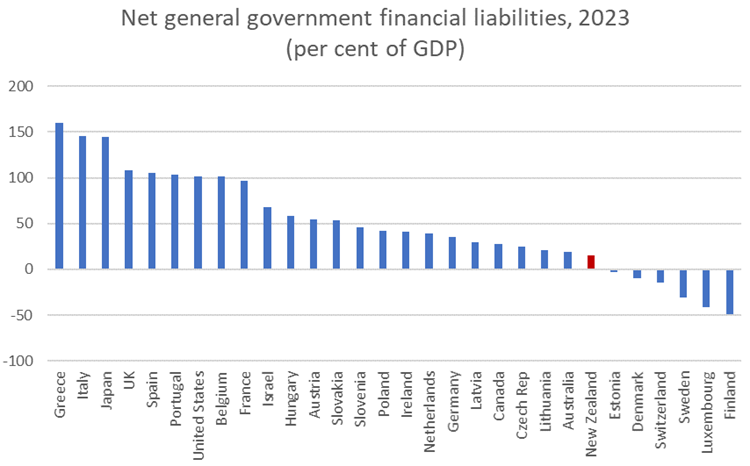
Source: Croaking Cassandra
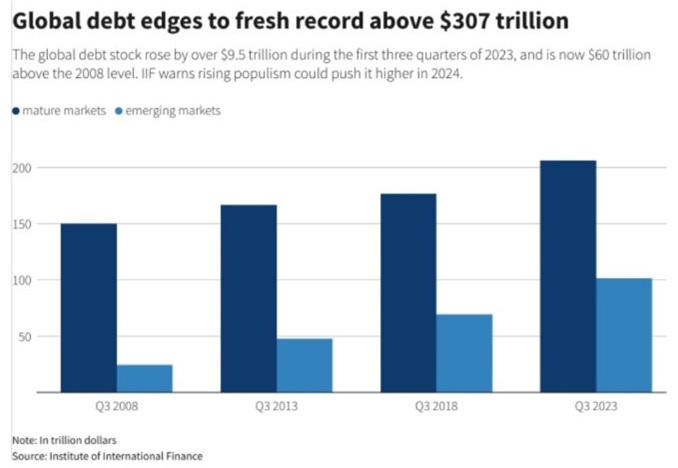
Note that the level of government debt and the ‘credit rating’ of that debt appears to have no relationship to the cost (the interest rate) of that debt. Further, the burgeoning supply of debt (chart below) also appears to have no effect on the interest rates demanded by bond investors. Global debt (including private debt) has risen to 300% of world GDP (US$100 trillion).
World government debt is estimated at about US$100 trillion, and the cost of that debt presents as remarkably low. This must be understood by investors investing across asset classes: a perversely low bond yield (the “risk-free” rate) affects the valuation and market prices of all assets.
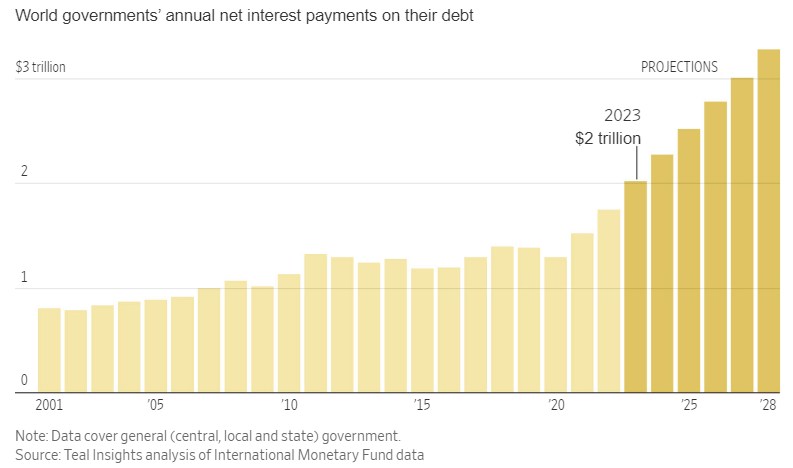
The chart below suggests that the interest cost of global government debt is a mere $2 trillion (or 2%), but it will dramatically increase by over 50% in the next 4 years as low coupon debt (set in the years before and during the pandemic) is rolled over. It looks very similar to the Australian household debt situation which I presented above.
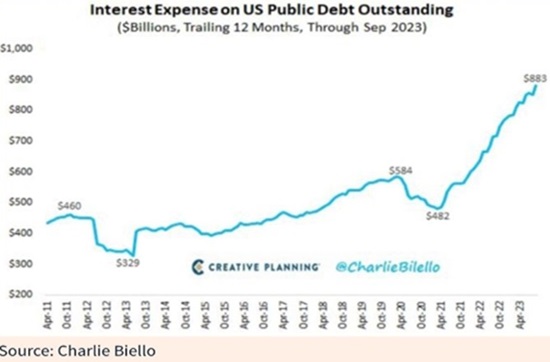
Most of the low coupon bond debt resides in the US (approximately US$30 trillion), Japan ($10 trillion) and Europe ($15 trillion). Importantly, both Japan (aggressively) and Europe (less aggressively) maintain QE programs that hold down bond yields. Today, a Japanese 10-year bond yields just 0.7% pa and cash rates are set at negative 0.1%.
Meanwhile the US Federal Reserve (the Fed) has lifted cash rates to 5.5% and modestly reversed its QE program to quantitative tightening (QT) as it attempts to deflate its massive $7 trillion balance sheet. As the Fed undertakes this, US bond yields have adjusted upwards and are driving up interest costs to the US government as shown below.
In passing, note that Australia’s 10-year bond yield – which is AAA rated – is currently 4.2% whilst Italy’s is 3.8% (rated BBB) and Greece is 3.35% (rated BBB-). A famous physicist named Julius Sumner Miller would have asked (like you should too) – Why is it so? The answer lies in the manipulation of bond yields caused by QE.
This leads me to the following conclusions for investors and asset allocators:
- Bond yields continue to be disengaged from the historic forces that determined the “risk-free” rate of return.
- Inflation, credit rating, currency risk and default risk have a weak connection with the market yield of bonds at present.
- Bond yields have been manipulated by central banks for over a decade and in Japan for near 25 years. Bond managers struggle to determine a fair value or yield with constant central bank intervention.
- Therefore, bond yields now have a poor forecasting capacity for the outlook for economies. That is, negative yield curves that historically forecast recession no longer do so.
- The experience of Japan is incisive because it shows that money printing (QE) does not necessarily cause either inflation, severe devaluation or economic calamity. Indeed, it suggests that QE is a viable (but not yet well-understood) economic tool.
- QE will therefore remain in the central bank toolkit. It will not and cannot disappear as the level of global government debt is simply too high.
Understanding macro forces is important, but it is also essential for that analysis to understand the effect of monetary manipulation.
Whilst all of us need to be concerned about the level of debt across the world, I would suggest the greater concern, indeed risk, would be if the world central banks resolved to not intervene in bond markets.
In a perverse way, it is high government debt that is protecting asset markets. High government debt continues to support the need for monetary intervention and manipulation. Investors need to understand the economic environment and monitor the monetary policy settings. Importantly investors need to stay fully invested across asset classes.
Based on the above and in conclusion I present my view on cash rates in 2024:
- Interest rates are too low in Japan but will stay low for the foreseeable future.
- Interest rates in Europe are low but will sit at this level until cost pressures flow out of inflation readings.
- Australian cash rates are appropriate and will remain at current levels until the US Fed cuts.
- US interest rates are too high and need to be adjusted down in the next few months (probably by June). The debt load of the US government suggests that QE will return at some point and so the Fed will be keen to flatten the yield curve below 4%.
John Abernethy is Founder and Chairman of Clime Investment Management Limited, a sponsor of Firstlinks. The information contained in this article is of a general nature only. The author has not taken into account the goals, objectives, or personal circumstances of any person (and is current as at the date of publishing).
For more articles and papers from Clime, click here.