The annualised inflation rate reached 2.7% at the end of the December 2013 quarter, which was higher than expected. Shortly after the inflation figure was announced, The Australian Financial Review ran a headline, “Real wages ‘have to fall’”, a view put forward by a number of economists and business leaders. This argument was given publicity despite modest real wage growth over the last year. Wages grew in real terms by only around 0.5% in the 12 months to 30 September 2013.
The topic of real wage growth often prompts the airing of strongly held views about global competitiveness and long term economic prospects. Less discussed is the fact that real wage growth directly impacts retirement outcomes.
Real wages and competitiveness
Real wage growth (that is, pay rises in excess of inflation) can be good or bad. High real wage growth is dangerous if it does not reflect productivity gains. It may be dangerous even if it does. For example, productivity improvement in a specific industry might be driven through a technology available worldwide, but some competing countries may use the technology to reduce product cost rather than increase wages.
Real wage growth has ramifications for long term international competitiveness. If Australian real wages are higher than in countries providing competing goods and services, then logic suggests we will lose business to those countries. In the short term, real wage growth is pleasurable as we have more to spend now. However it is likely to catch up with us if it is not supported by productivity growth as our country loses competitiveness. This could affect us in many ways – for example, a sustained period of our businesses struggling to compete globally, poor stock market performance, a prolonged period of adjustment to future wage growth and employment, and a weaker dollar and associated reduction in purchasing power. However these things are difficult to predict and put a timeframe around.
Replacement ratios in retirement
Real wage growth directly affects retirement outcomes in a couple of ways: dollar outcomes and replacement rates. I like the concept of replacement rates: the ratio of post-retirement cash flow to pre-retirement income. I adjust the pre-retirement income for tax and savings, so what we have is a ratio of how much we have to spend in retirement versus consumption when working. To summarise:
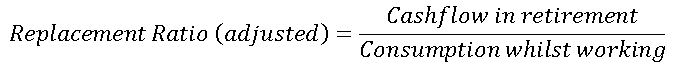
A high replacement ratio would be desirable, but forecasting replacement ratio outcomes is complex and difficult. Treasury has a huge model and some industry participants also have advanced ones. I developed one for a thesis and have written about it in Cuffelinks (see May 16, 2013 issue). Importantly, projected outcomes will differ across the population. I follow Treasury’s approach and use forecasts for different income quartiles.
These are the numbers I produced at the end of 2011:
Table 1: Projected replacement rate outcomes. Note ‘Earnings Multiple’ refers to income as a multiple of AWOTE (a measure of average earnings across the population).
|
Earnings
Multiple
0.75
1.0
1.5
2.5
|
Average Replacement
Rate Ratio
81.1%
68.4%
56.0%
61.0%
|
Table 1 shows that replacement rates look higher for low income earners compared to higher income earners. This is because they receive the age pension but their current incomes are low and to live on even less would be difficult. Higher earners experience lower replacement rates but they can probably live with this as their pre-retirement incomes are higher.
Note the slight quirk here. Very high (top quartile) earners have a higher expected replacement rate ratio than the third tier. Why? In my modelling, you have to earn a very high income to save beyond paying down your mortgage, and the third (second top) tier earners run the risk of feeling wealthy but experiencing a retirement outcome well below their expectations.
Wages and retirement income
Real wage growth has two direct effects on retirement outcomes.
First, it pushes up age pension payments, which are indexed to whichever is the greater: wage growth, inflation or the age pensioners living cost index. Wage growth is expected to be the highest and this pushes up pensions. About 80% of the population is forecast to receive at least a part age pension at some point, and of these, half will receive full pensions.
The second effect is the level of wages against which we compare our outcomes (the main part of the denominator in the replacement rate equation). If we experience high real wage growth then, all else being equal, retirement savings and hence retirement income potential will grow at a slower rate relative to wages.
People will be affected in different ways, depending on incomes. The table below explains some of the sensitivities.
Table 2: Altered real wage growth levels (base case assumption of real wage growth was 1.5% pa) and associated changes to projected replacement rate outcomes.
|
Earnings
Multiple
0.75
1.0
1.5
2.5
|
Real Wages
+0.5% pa
0.8%
0.5%
0.0%
-2.5%
|
Real Wages
-0.5% pa
-1.1%
-0.4%
0.7%
2.7%
|
Table 2 shows that low income earners will experience better replacement rate outcomes if real wage growth is high, because of higher age pensions. Their replacement rate would be just under 1% higher. It is the top quartile income earners who lose out if real wage growth is high: their replacement rate would be around 2.5% lower. Note, though, that this is relative to their working life income levels, which would be higher under a high real wage growth scenario, so don’t worry too much for the higher income earners.
To sum up, increasing real wages doesn’t seem a bad scenario in terms of the direct impact on retirement outcomes. Don’t forget however that higher age pensions (resulting from higher real wage growth) are funded by the government and it must raise this money from somewhere.
This analysis only considers the direct effects of changes to real wage growth, but there could be secondary effects. For instance what if high real wage growth led to loss of competitiveness and a prolonged period of poor market performance? While this is a large call to make, it is interesting to consider the impact.
Table 3: Altered long term investment returns (base case assumption of long term investment returns was CPI + 4.75% pa) and projected changes to replacement rate outcomes.
|
Earnings
Multiple
0.75
1.0
1.5
2.5
|
Investment
Returns +0.5% pa
3.3%
3.3%
4.6%
7.6%
|
Investment
Returns -0.5% pa
-3.0%
-2.8%
-3.5%
-6.2%
|
Table 3 shows that changes to investment return assumptions have a much greater impact on replacement rate outcomes than changes to real wage growth. Your super fund may actively manage this risk in its investment strategy. In fact, some large super funds benefited last year from shifting allocations from Australian shares into global equities.
In summary, real wage growth does pose a direct threat to retirement financial outcomes, but it is the indirect effects, particularly around international competitiveness and investment returns, lurking in the shadows that create greater concern.
David Bell’s independent advisory business is St Davids Rd Advisory. David is working towards a PhD at University of NSW.