A handful of large technology stocks have garnered attention for outsize returns in recent years. Collectively referred to by the FANMAG acronym, Facebook, Amazon, Netflix, Microsoft, Apple, and Google (now trading as Alphabet) all substantially outperformed the US market (as defined by the Total Return US Market Research Index*) in the eight calendar years that they have all been public companies (Facebook went public in May 2012).
Emerging as winners from among a large number of companies that fared less well during 2013–2020, these juggernauts bested most of their surviving peers with annualised outperformance versus the US market ranging from 7.3% (Alphabet) to 42.6% (Netflix), as shown in Exhibit 1.
(Note that performance data used in the exhibits is from January 2013 to November 2020).
Exhibit 1: At the top of their game, annualised compound return in excess of US market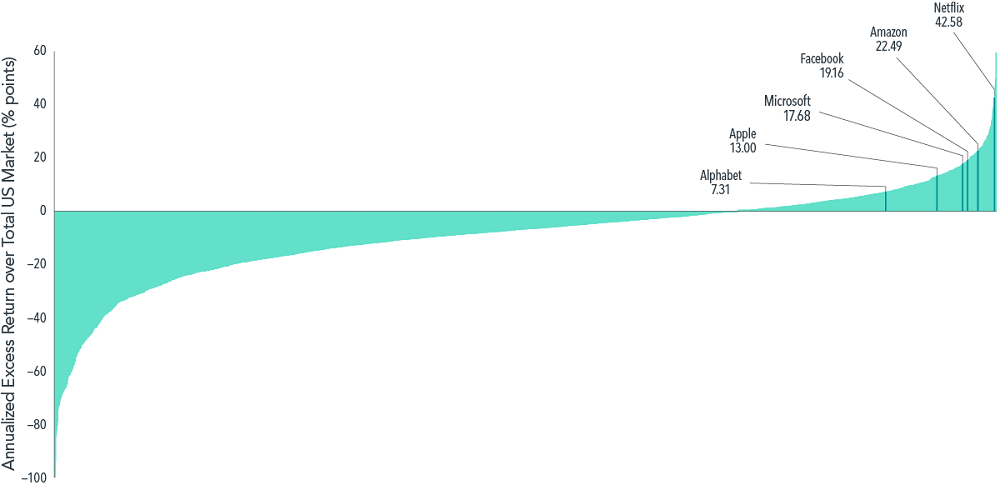
But many other tech companies underperformed
While this performance dazzled investors and dominated headlines during 2013–2020, a more complete picture emerges when accounting for the many companies whose investors were less fortunate over the period.
As shown in Exhibit 2, of the 10 largest US technology stocks as of January 2013, all but Apple, Microsoft, Alphabet, and Amazon underperformed the US market over the same period that elevated their tech peers to financial market stardom.
Exhibit 2: Same game, different outcome
Performance of the 10 largest US technology stocks.
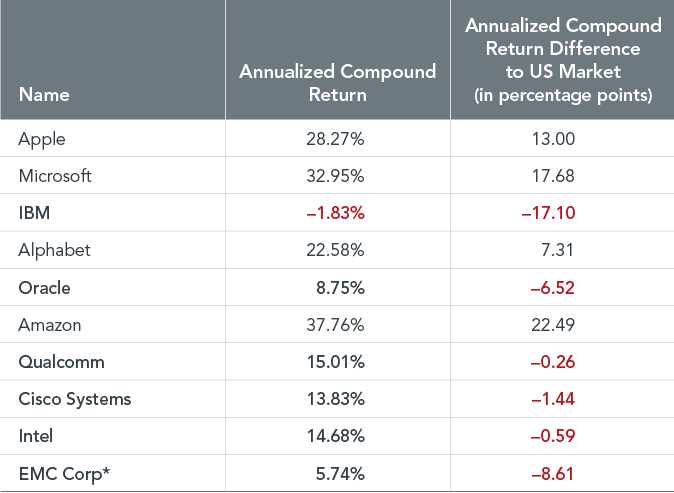
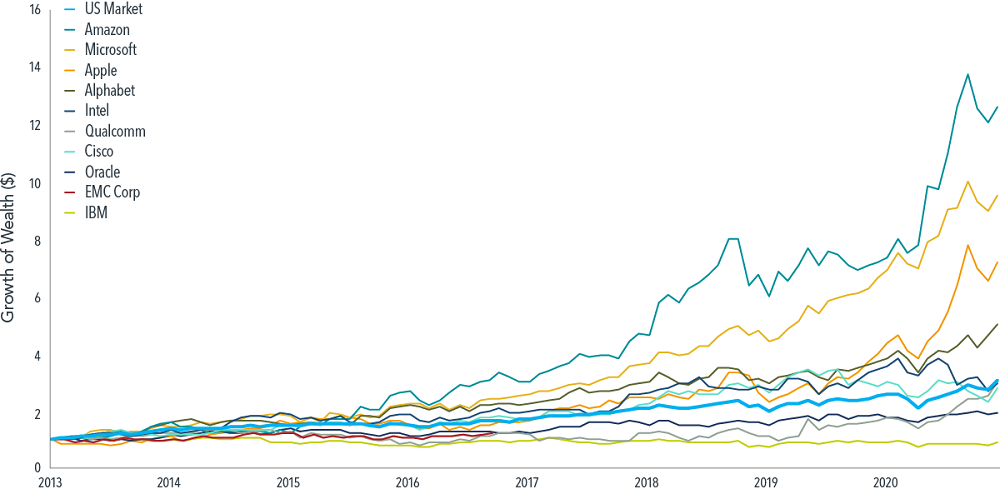
Exhibit 3 shows the hypothetical growth of wealth for an investor who put $1 in each of the 10 largest technology stocks and the US market in January 2013. While the $1 invested in Amazon and Apple, for example, would have grown to $12.63 and $7.18, respectively, by November 2020, the returns of their non-FANMAG tech contemporaries would have failed to even surpass the US market.
Exhibit 3: Growth of wealth for 10 largest US technology stocks
FANMAG returns certainly stand out among those of their contemporaries, but the range of individual stock outcomes has often been immense. A historical look shows that FANMAG performance has been quite ordinary in the context of past top-of-the-market performers.
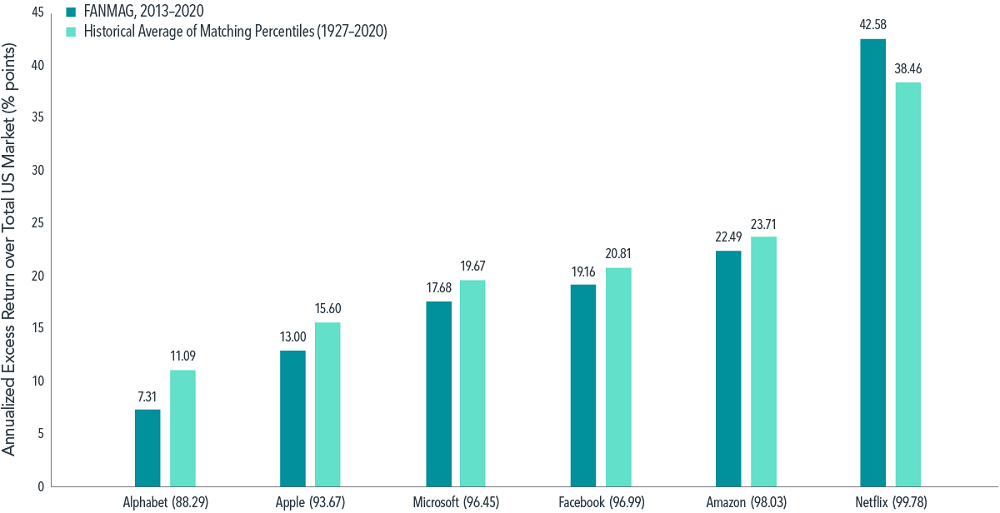
Drawing on stock return data since 1927, Exhibit 4 indicates that historical top performers often experienced larger outperformance relative to the US market than the FANMAG stocks realized during 2013–2020.
For example, Apple’s 2013–2020 annualized excess return of 13% places it at the 93rd return percentile among all US stocks that were trading in January 2013 and survived the eight-year period that followed. However, the average outperformance of stocks at the 94th percentile over eight-year rolling periods from 1927 to 2020 was 15.60%, or about 2.60% higher.
With the exception of Netflix, the same holds for the other FANMAG stocks, with historical outperformers at the same return percentile outperforming the market by more than the FANMAG stocks did in 2013–2020.
Exhibit 4: A familiar tale for the right tail
FANMAG outperformance vs. US market, 2013–2020, compared to average historical outperformance of stocks at same return distribution percentile over rolling eight-year periods, 1927–2020
Large US companies have done even better in the past
A defining trait of the FANMAG performance is that these outsize returns have come from among the largest companies in the US, implying they were meaningful contributors to the overall US market’s return. However, historical data show that this too is nothing new.
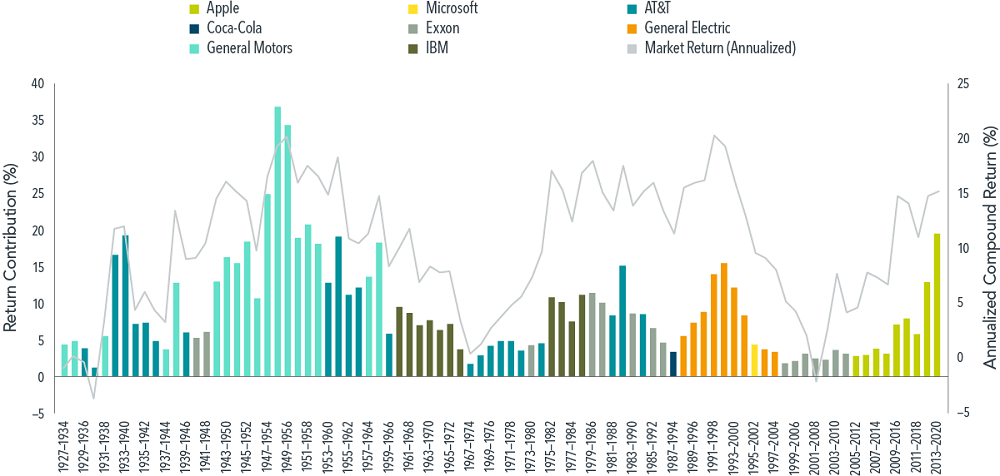
Defining a stock’s return contribution as its total return weighted by its beginning-of-period market capitalization weight, we see that Apple’s contribution to the US market for the period 2013–2020 was 19.68%.
How does this figure compare to other top return contributors? Exhibit 5 illustrates the top return contribution and the annualized US market return over rolling eight-year periods since 1927, revealing instances of return contributions by the likes of AT&T, General Motors, and General Electric that were comparable to, or even exceeded, that of Apple in 2013–2020.
Exhibit 5: Key contributors
FOTW (Flavor of the Week)
If history is any guide, the FANMAG acronym will eventually be replaced by another trendy name. For example, stock market historians will remember the Nifty Fifty in the 1960s and 70s, a set of 50 blue-chip stocks like Coca-Cola and General Electric. The early 2000s witnessed increasing adoption of the acronym BRIC, representing investment opportunities in the fast-growing emerging economies of Brazil, Russia, India, and China. More recently, the WATCH companies - Walmart, Amazon, Target, Costco, and Home Depot - have also gained traction in the market’s lexicon.
While documenting trends in finance is entertaining, there is little evidence that investors can spot these trends in advance in a way that would enable market-beating performance. Moreover, concentrated bets on high-flying stocks can expose investors to idiosyncratic risks and a wider range of possible outcomes.
By contrast, a sound investment approach based on financial science emphasizes the importance of broadly diversified portfolios that provide exposure to a vast array of companies and sectors to help manage risks, increase flexibility in implementation, and increase the reliability of outcomes.
Ishan Ghosh, PhD a Researcher at funds management firm, Dimensional Fund Advisors. This article is general information and does not consider the circumstances of any investor. Named securities may be held in accounts managed by Dimensional. This information should not be considered a recommendation to buy or sell a particular security.
Glossary
*Fama/French Total US Market Research Index: The value-weighed US market index is constructed every month, using all issues listed on the NYSE, AMEX, or Nasdaq with available outstanding shares and valid prices for that month and the month before. Exclusions: American depositary receipts. Sources: CRSP for value-weighted US market return. Rebalancing: Monthly. Dividends: Reinvested in the paying company until the portfolio is rebalanced. Results shown during periods prior to each index’s index inception date do not represent actual returns of the respective index.