While the media coverage surrounding the budget is full of facts, figures and opinions, much of the debate is clouded by political rhetoric and misinformation. Issues like whether deficits are good or bad for the country as a whole and for present and future tax-payers – and indeed what the money is actually spent on (ie productive assets or welfare, etc) - are important questions for another day.
This paper is about facts, not opinion or judgment, and puts the current budget into context and considers what budget deficits mean for investors. In particular:
- how often have governments produced budget surpluses?
- how do Labor and Liberal governments compare when it comes to deficits and debt?
- how serious are the current levels of deficit and debt?
- have government deficits been good or bad for stockmarkets?
History of Federal Government surpluses, deficits and debt
Our first chart shows the history of federal government fiscal balances and debt levels since Federation, and it also shows the various governments in power. Labor governments are shown in pink and ‘right leaning’ governments in blue.
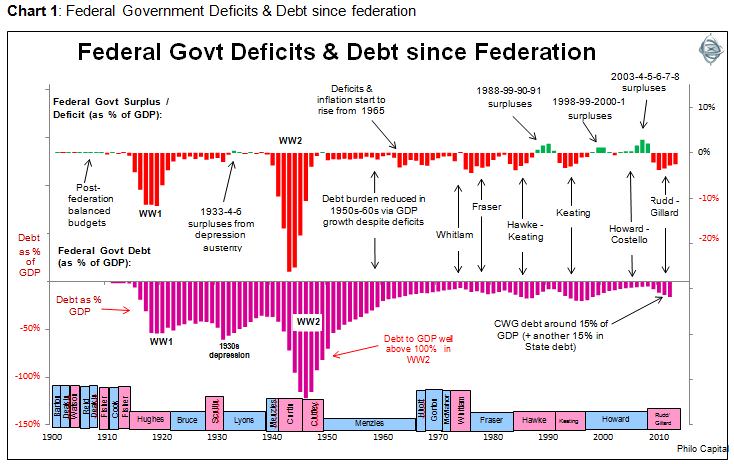
The top section shows the annual government balance (surplus or deficit) expressed as a percentage of GDP (June years). We can see that governments have run surpluses (green bars in the top section) in only a very small minority of years.
Chart 2 shows that Labor governments have achieved government surpluses in only 18% of all years they have been in power, while right-leaning governments have done marginally better, with surpluses in 26% of years in power.
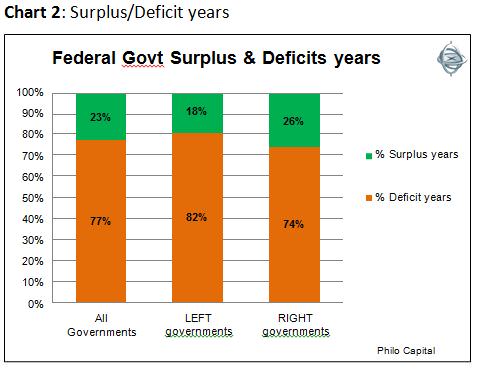
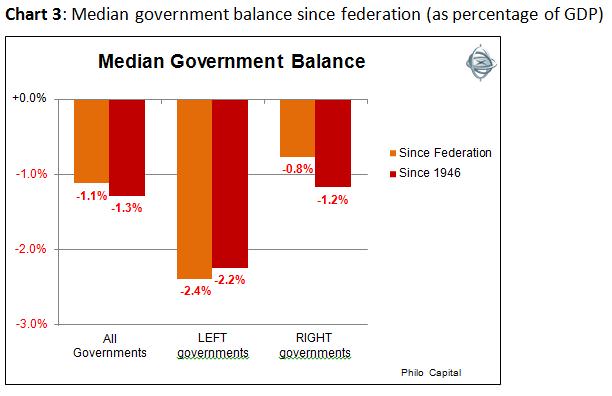
Chart 3 shows that on average Labor budget balances have been worse than right-leaning governments (ie Labor has tended to run larger deficits). Even if we just look at the post-war era the differences are still significant, and probably reflect the philosophical differences between the major parties over the role of government in the economy.
Changes in government fiscal balances
More important than the actual level of government fiscal balance from year to year is the change in the balance. This is the case for a couple of reasons. The first is that every government inherits the budget position from the last government and so it has more control over changes in government spending and revenues than it has over the levels of spending and revenues themselves.
The second reason is that it is the change in balance rather than the level that reflects the incumbent government’s fiscal stance and its effects on the economy. For example, if a government goes from a deficit of $40 billion in one year to a deficit of ‘only’ $10 billion in the next year, the $30 billion in lower spending and/or higher taxes in the second year represents a substantial tightening of fiscal policy even though the deficit in the second year appears expansionary if viewed in isolation.
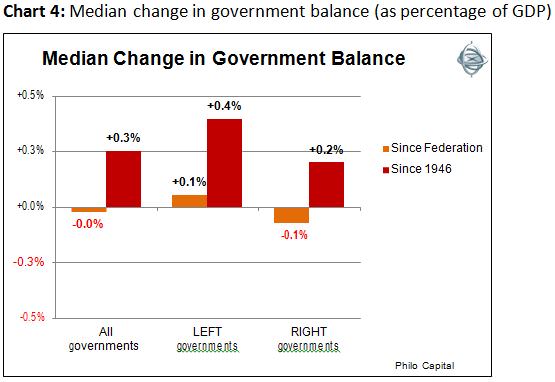
Chart 4 shows that left wing governments have a slightly better record of reducing deficits over the whole period and also in the post-war period, although in most cases it was reducing their own deficits, since Labor governments ran larger deficits overall.
Deficits and stockmarket returns
But what does all of this mean for investors?
Chart 5 shows the annual federal government balance plotted against real total returns from shares (ie including re-invested dividends and after CPI inflation) since 1946. Years are ending in June to line up with the fiscal years. Labor government years are shown in red and right leaning government years are shown in blue.
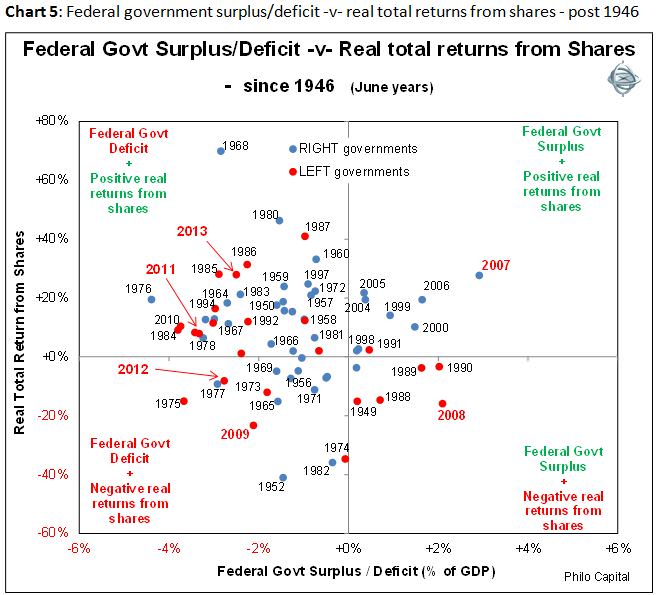
There has been a mildly negative correlation between the government balance and stock market returns. Most of the high return years from shares were government deficit years (top left section), including 2011 and 2013.
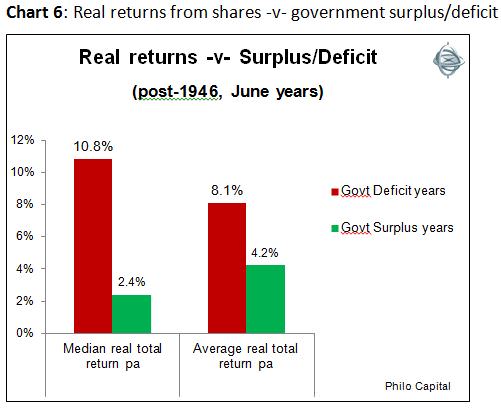
Deficits are generally good for shareholders and surpluses are generally bad for shareholders. In the post-war era the median real total return from shares was 10.8% pa in the deficit years but only 2.4% pa in the surplus years, which is a very significant difference, as shown in Chart 6.
There are two main reasons for this. The first is that deficits come about by governments spending more money (and/or taxing less), and much of the additional cash ends up in company coffers, either directly via contracting to government, or indirectly via household spending. The second is timing. Deficits tend to be high in mid-late recessions (when tax revenues are down and welfare spending is up), and this is when shares generally do best, rebounding out of the middle of recessions. This was the case in 1954, 1972, 1983, 1992 and 2010, (and in the pre-war years: 1922, 1923 and 1932).
There have been very few years when government surpluses accompanied poor returns from shares (bottom right section in Chart 5). The most obvious instance was 2008, when tax revenues from the boom were still rolling in but shares were already falling in the GFC. However the differences are not as significant as the stark differences in returns in deficit years versus surplus years.
Some conclusions
This paper adds some factual context to the current highly-charged debate and we can draw some conclusions:
- government deficit years have generally been good years for stock market returns. 2013-4 will be a deficit year, as was 2012-3
- years of fiscal tightening have been a little better for stock market returns than years of fiscal loosening. 2013-4 will probably be a year of fiscal tightening (as was 2012-3)
- in the post-war era, Labor has produced four surplus years against the Liberal’s eleven
- today’s level of government debt is much lower than it was in the two World Wars and in the 1930s depression
- the current interest burden (at less than 1% of GDP and around 3-4% of tax receipts) is no higher now than it was in the 1950s, 1960s and 1970s
- the pre-WW1 period was a golden era of balanced budgets and no Canberra!
Ashley Owen is Joint Chief Executive Officer of Philo Capital Advisers and a director of Third Link Investment Managers.