Register For Our Mailing List

Register to receive our free weekly newsletter including editorials.

Home / 62

Budget time and Labor v Liberal on fiscal discipline

Part 1: Which political party has produced more government surpluses and deficits?

Much of the media coverage and debate surrounding the federal budget is coloured by political bias, uninformed rhetoric, misinformation and value judgments about whether deficits are inherently good or bad. Here we stick to the facts. While the impacts of fiscal policy on such things as jobs, pensions, debt burdens and the implications for current and future taxpayers make for heated dinner conversations, investors are primarily interested in the impacts on investment markets.

This 3-part series will put the federal budget into perspective and address questions such as:

  • How often have governments produced budget surpluses? (Part 1)
  • How do Labor and Liberal governments compare when it comes to deficits? (Part 1)
  • How do Labor and Liberal governments compare when it comes to running up (or paying off) debt? (Part 2)
  • How serious are the current levels of deficit and debt? (Part 2)
  • Have government deficits been good or bad for stock markets? (Part 3)

Issues such as whether deficits are good or bad for the country as a whole or what the money is actually spent on (i.e. productive assets or recurrent welfare, etc) are questions for another day.

History of federal government surpluses, deficits and debt

The first chart shows the history of federal government fiscal balances and debt levels since Federation, and it also shows the various governments in power. Labor governments are shown in pink and ‘right-leaning’ governments, mainly Liberal and Liberal Coalitions, in blue.

Chart 1: Federal government deficits and debt since Federation
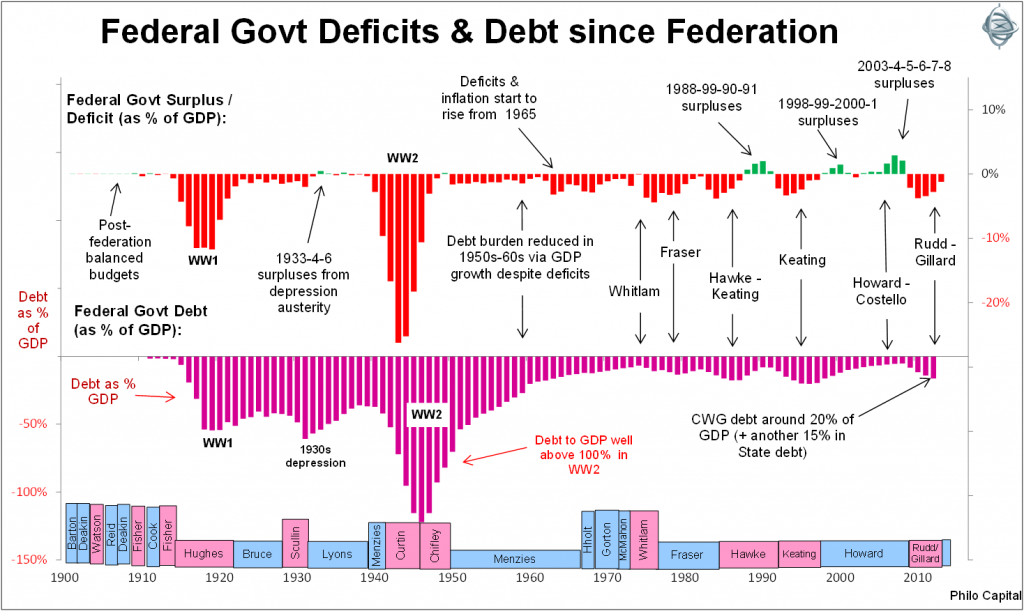
The top section shows the annual government balance (surplus or deficit) expressed as a percentage of GDP, for June years up until June 2013. (Gross Domestic Product, or ‘GDP’ is a common measure of total national output, production, income and spending). A government surplus or deficit in a given year is the total amount of government revenues collected (mostly through taxation) minus total government outlays.

Most of the media attention each year is centred on the budget speech in May of each year (was August in the early years) for the following fiscal (June) year. The budget speech is a statement of policy and intent, but budget measures announced are often amended or modified during the year. What we are concerned about here is the actual outcome each year. That is not just talk or policy or politics, it is fact.

We can see that federal governments have run surpluses (green bars in the top section of the above chart) in only a very small number of years since Federation.

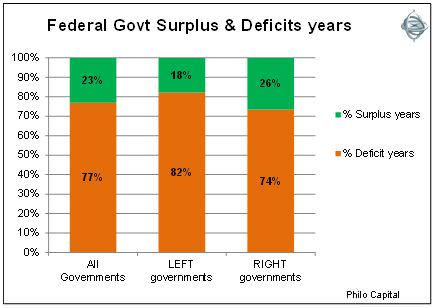
Chart 2 shows that Labor governments have achieved government surpluses in just 18% of all years they were in power, while right-leaning governments have done marginally better, with surpluses in 26% of years in power.

Chart 2: Surplus/Deficit years
Surplus years are rare

Surplus years have been few and far between. Aside from the early years of balanced budgets (before Canberra existed!), the only surplus budget outcomes have been in the following years:

  • 1933, 1934 and 1936 resulting from the depression austerity plan under Joe Lyons (UAP). Deficit spending to stimulate the economy was not an option because foreign credit markets refused to lend to Australian governments following the default and restructure on the entire stock of domestically held government bonds in 1931. The government had no option but to balance the budget by imposing austerity measures including savage cuts to wages and spending
  • 1949 (just) under Chifley (Labor)
  • 1988, 1989, 1990 and 1991 under Hawke/Keating, in the late 1980s boom prior to the deficit spending in the 1990-1991 recession
  • 1998, 1999, 2000 and 2001 under Howard/Costello, in the ‘dot-com’ boom prior to the impact of the ‘tech wreck’ slowdown
  • 2003 through to 2008 under Howard/Costello (although Labor under Kevin Rudd won the election during the 2008 fiscal year), in the 2000s mining/credit boom prior to the ‘global financial crisis’.

Chart 3 shows Labor budget balances have been worse on average than Liberal/right governments (ie deficits under Labor governments have been double the size of deficits under Liberal/right governments).

Chart 3: Median government balance since federation (as percentage of GDP)
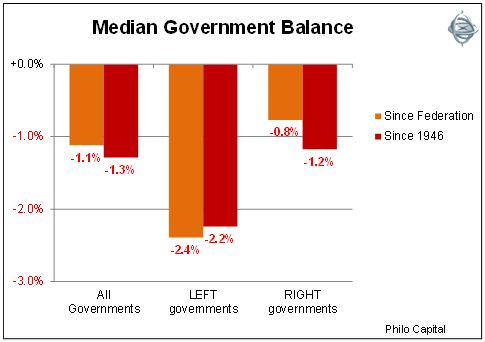
Even if we just look at the post-war era the differences are still significant, and reflect the philosophical differences between the major parties on the role of government in society and in the economy.

Changes in government fiscal balance

More important than the actual level of government fiscal balance from year to year is the change in the balance. This is the case for a couple of reasons. The first is that every government inherits the budget position from the prior government and so the incumbent government has more control over changes in government spending and revenues than it has over the levels of spending and revenues.

The second reason is the change in balance rather than the level reflects the incumbent government’s fiscal stance and its effects on the economy. For example if a government goes from a deficit of $50 billion in one year (as it will in 2013-14) to a deficit of ‘only’ $30 billion in the next year (as is forecast in 2014-15), the $20 billion in lower spending and/or higher taxes in the second year represents a substantial tightening of fiscal policy even though the deficit in the second year appears expansionary if viewed in isolation.

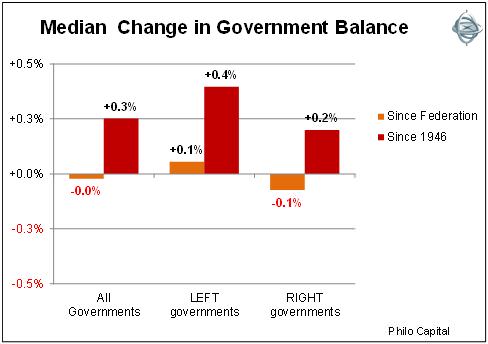
Chart 4 shows that Labor governments have a slightly better record of reducing deficits over the whole period since Federation and also in the post-war period, although in the majority of cases it was reducing their own deficits, since Labor governments also ran significantly larger deficits than Liberal governments.

Chart 4: Median change in government balance (as percentage of GDP)
Some conclusions

Some conclusions include:

  • Apart from the golden era before Canberra existed, and in the 1930s depression when Australian governments were excluded from foreign debt markets (and therefore unable to run deficits) following the default, government surpluses have been very rare.
  • The surpluses occurred in unsustainable economic booms – the late 1980s credit-driven ‘entrepreneurial’ boom, the late 1990s ‘dot-com’ boom, and the 2000s credit and mining boom.
  • Australia’s unusually high levels of population growth, economic growth, favourable demographics and broadening tax revenue base are conducive to central governments running modest on-going deficits, as long as the deficits are used to invest primarily in productive assets rather than recurrent spending and welfare. To date this has tended to be the case in Australia.
  • The string of government deficits during Labor’s most recent period in office was not unusual compared to prior Labor or Liberal/right-leaning governments.
  • Labor governments have run fewer surpluses and larger deficits (expressed as per cent of GDP) compared to Liberal/right-leaning governments.
  • In the post-war era, Labor has produced four surplus years compared to the Liberals’ eleven. In the pre-war era, the big debt build-ups in WW1 and WW2 were bi-partisan, but the 1930s surpluses were the result of partisan austerity measures of the Lyons UAP governments (forerunner to Liberal Party).
  • The pre-WW1 period was a golden fiscal era of balanced budgets and no Canberra!

In Part 2, we will look at the record of Labor versus Liberal governments in running up (or reducing) government debt levels. Then in Part 3, we will examine the impact of government deficits and surpluses on stock market returns, under Labor and Liberal governments.


Ashley Owen is Joint CEO of Philo Capital Advisers and a director and adviser to the Third Link Growth Fund.


  •   16 May 2014
  • 7
  •      
  •   
7 Comments
Pat Connelan
May 16, 2014

The state of the budget is largely a reflection of what's happening in the global and local economic cycles.

It's in the media's interests to talk up whether brand Pepsi or brand Coke is better at balancing the budget, but discretionary outlays are just one part of the input to the process.

Howard and Costello governed during a boom; Rudd, Gillard and Swan during the worst developed economy recession since the 30s.

When comparing outcomes you need to look at what was achieved given the parameters of the time. Arguably, a government which delivers small surpluses at a time of glorious prosperity and massive tax receipts is less capable than one who manages aggregate demand successfully during a global bust but at the expense of modest deficits.

Budget surpluses aren't ends in themselves. There is no right or wrong about them. What matters is good policy attuned to the needs of the cycle and the social and civic obligations of government.

James Davey
May 16, 2014

As Dickens correctly said "Annual income twenty pounds, annual expenditure nineteen nineteen and six, result happiness. Annual income twenty pounds, annual expenditure twenty pounds ought and six, result misery".

LKB
May 16, 2014

And as a mentor of mine once drilled into me: when in debt, a dollar spent is a dollar borrowed.

mkin
November 18, 2017

Govt deficits help grow the economy to the point where the non govt sector booms. Then when the economy is net spending govt debt falls. Govt borrowing is for liquidity control not to fund spending.
A fiat currency govt creates dollars when it spends. The is the whole reason govts abandoned the fixed exchange rate system.

Alan Austin
May 07, 2022

The problem with this analysis is that it fails to take into account the global economic conditions at the time of each government.
A much more sound approach is to look at where Australia ranked in the world, or among developed economies, on deficits and debt for each year. That is the approach taken here and elsewhere:
https://michaelwest.com.au/scott-and-josh-superior-economic-managers-not-according-to-the-imf/
Can you please try this, Ashley, and see how your results compare with those in Michael West Media.
Happy to discuss. Cheers, AA.

R Curtin
February 11, 2025

You should have noted World War 2 spending distorted this comparison.

Gus Berenyi
May 01, 2025

Is it possible to get an update on the data in this post? Really interesting stuff


Leave a Comment:

RELATED ARTICLES

Running up and paying off government debt

Federal Government budgets and their impact on the stockmarket

Energy policy must prioritise the economy

banner

Most viewed in recent weeks

Are you making these SMSF mistakes?

After four decades advising investors, there are a few common mistakes I've seen SMSF investors make. From holding too much cash and chasing yield to overtrading and trusting tips. Are these errors costing you?

Why have Australian living standards 'fallen' and how do we fix it?

For the last few years there has been much talk of a 'cost-of-living' crisis in Australia and of 'falling living standards'. Lately this has flared up again with the pickup in inflation resulting in a renewed fall in real wages.

Retirement spending is not one-size-fits-all

New data challenges the idea that Australians are underspending their super. The bigger issue may be helping retirees navigate complexity, make confident decisions and use their savings to support security, wellbeing and choice.

Will you run out of money in retirement?

Fear of running out has become a defining retirement anxiety. Why do some retirees die with substantial wealth while others deplete their nest egg? Evidence suggests the answer is more complicated than we think. 

Four options for an income investor’s next dollar

What if Australia’s golden age of dividends is ending? Rather than overhaul your portfolio, it may be worth considering where new capital can work harder. I discuss four income strategies and the trade-offs behind each.

The missing link in the CGT debate

A little-noticed consequence of Labor’s tax changes could have implications well beyond investors’ tax bills. The issue raises bigger questions about incentives, capital allocation and the drivers of long-term economic growth.

Latest Updates

SMSF strategies

Meg on SMSFs: What do we think about reversionary pensions these days?

Reversionary pensions have long been a staple of SMSF estate planning, but are they still the best option? Meg Heffron revisits a once-clear favourite and asks whether changing super rules have shifted the balance.

The ageing ‘crisis’ has not and will not happen

Rising age dependency is frequently treated as a warning sign for economies. But when actual workforce participation is examined, a strikingly different picture emerges about ageing, productivity and economic sustainability.

Retirement

How does the 4% rule stack up?

The 4% rule has long been retirement's gold standard. But after a difficult period for investors, fresh analysis suggests a more conservative approach may significantly improve the chances of making savings last.

Shares

Four charts that expose market concentration risk

Investors have recently been rewarded for backing market leaders, but history suggests this eventually comes at a cost. Now may be the time to review whether your portfolio is carrying unintended risks beneath the surface.

Investment strategies

The case for gearing beyond property

Most Australians gear into property but ignore shares. That may be a mistake. Used carefully, geared equity strategies can enhance long-term returns, reduce cash tied up in growth assets and support retirement income goals.

Economy

Australia's $1 trillion debt pile

The headlines exclaiming that Australian government debt has hit A$1 trillion and US government debt has hit $40 trillion has turned heads, but how serious are they really? Will Australia's mix of debt create challenges?

Economy

Has 100 years of growth made us any happier?

For decades, GDP has been the benchmark for economic success, but has it made us materially happier? If happiness does not rise in lockstep with prosperity, are we overlooking what constitutes a successful society?

Sponsors

Alliances

  • ASA-Logo-RGB-ActiveGreen-web.png

© 2026 Morningstar, Inc. All rights reserved.

Disclaimer
The data, research and opinions provided here are for information purposes; are not an offer to buy or sell a security; and are not warranted to be correct, complete or accurate. Morningstar, its affiliates, and third-party content providers are not responsible for any investment decisions, damages or losses resulting from, or related to, the data and analyses or their use. To the extent any content is general advice, it has been prepared for clients of Morningstar Australasia Pty Ltd (ABN: 95 090 665 544, AFSL: 240892), without reference to your financial objectives, situation or needs. For more information refer to our Financial Services Guide. You should consider the advice in light of these matters and if applicable, the relevant Product Disclosure Statement before making any decision to invest. Past performance does not necessarily indicate a financial product’s future performance. To obtain advice tailored to your situation, contact a professional financial adviser. Articles are current as at date of publication.
This website contains information and opinions provided by third parties. Inclusion of this information does not necessarily represent Morningstar’s positions, strategies or opinions and should not be considered an endorsement by Morningstar.