Register For Our Mailing List

Register to receive our free weekly newsletter including editorials.

Home / 202

Government debt: how much is too much?

The 2017 Federal Budget has turned attention as usual to the issue of government debt. Commonwealth governments ran a surplus during the mining boom from 2003-2008 but it has run deficits since the GFC to prop up employment and growth. The deficits have been funded by running up $500 billion (and rising) in debt. Is this too high? Can we afford it?

The first chart shows the history of annual Commonwealth government balances since Federation. The bars in the top section shows the annual government balance each year. We can see that surpluses (green bars) have been rare indeed. The pink bars in the lower section show debt as a percentage of national output (GDP) each year. The current level of debt at 25% of national output is higher than it has been since 1959.

The government ran rare surpluses during the mining boom from 2003-2008 thanks to high commodities prices but since the GFC a succession of big-spending governments have run up deficits to prop up employment and growth. Strategically timed spending sprees on ‘pink bats’ and ‘school halls’ meant we narrowly avoided an economic recession (arbitrarily defined as two consecutive quarters of negative national output growth), but the cost was a build-up of national debt that will take decades to repay.


Is the current debt to GDP ratio too high?

The main debt build-ups were due to the massive deficit spending in the two World Wars. The ratio of debt to national output also increased during the 1930s depression but it was not because of big spending and borrowing, it was because of the massive contraction in national output.

In the first half of the 20th century, Australia was seen as a high-risk borrower in global debt markets, suffering a default and full-scale Greece-style debt restructure in 1931. Australia regained respectability as a borrower in global debt markets after the post-war economic boom reduced debt in the 1950s.

The current level of Commonwealth government debt relative to national income is not high in historical terms but it is high in post-war terms. It is lower than almost every other country in the world today - but that doesn’t make it right. The current $500 billion pile of federal government debt is costing tax-payers $16 billion per year, or $44 million every day, or $1.70 per person per day. This sounds a lot but there is more to the story.

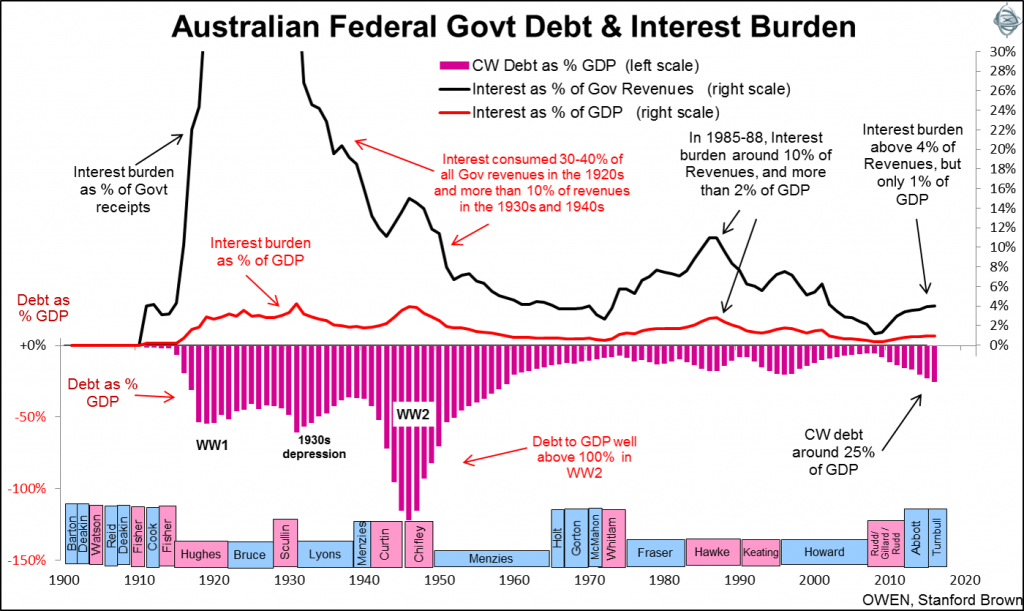
More important than the level of the debt is the affordability of the debt. The second chart shows the cost of servicing government debt in the upper section of the chart.

Government debt Click to enlarge

Here we see the cost of interest on this debt as a percentage of national income (GDP) in the red line and also as a percentage of government receipts (mainly tax revenues) in the black line.

The current interest burden is modest and affordable, at 4% of government revenues and just 1% of national income. This is lower than almost any other time since before World War 1, and lower than almost every other country in the world today. Market yields on government bonds have been rising since the middle of 2016 after the Brexit vote but are still at low levels. Rising bond yields don’t translate into higher interest payments until each bond matures in the future and is re-financed by another bond at a higher rate, which in some cases is 30 years into the future. Even if bond yields rise rapidly the interest cost will remain low for many years.


Based on affordability, the current debt is manageable

If the Commonwealth government were a company the board would be sacked for having a ‘lazy balance sheet’ and not borrowing enough to invest in productive assets for future growth.

But here’s the problem. Investing for the long-term future requires coherent vision, long term commitment and willingness to make tough decisions. These critical qualities have been sadly lacking in the recent succession of short-term revolving door governments in Canberra.

I don’t see this improving any time soon. Voting power continues to drift in favour of the aging population of people who have not saved enough for their retirement, at the expense of the young who will have to pay for the deficits for decades to come. The current addiction to debt and fear of electoral backlashes from painful reforms will probably continue. But why worry? About every 30 years, a mining boom comes along that delivers freakish commodities prices and windfall revenue gains.

The windfall revenue gains from the last mining boom were squandered on middle class welfare that is proving extremely hard to wind back. Let’s hope our kids and grand-kids handle the next one better.


Ashley Owen is Chief Investment Officer at privately-owned advisory firm Stanford Brown and The Lunar Group. He is also a Director of Third Link Investment Managers, a fund that supports Australian charities. This article is general information that does not consider the circumstances of any individual.

  •   18 May 2017
  • 3
  •      
  •   
banner

Most viewed in recent weeks

Australian stocks will crush housing over the next decade, 2025 edition

Two years ago, I wrote an article suggesting that the odds favoured ASX shares easily outperforming residential property over the next decade. Here’s an update on where things stand today.

Building a lazy ETF portfolio in 2026

What are the best ways to build a simple portfolio from scratch? I’ve addressed this issue before but think it’s worth revisiting given markets and the world have since changed, throwing up new challenges and things to consider.

Get set for a bumpy 2026

At this time last year, I forecast that 2025 would likely be a positive year given strong economic prospects and disinflation. The outlook for this year is less clear cut and here is what investors should do.

Meg on SMSFs: First glimpse of revised Division 296 tax

Treasury has released draft legislation for a new version of the controversial $3 million super tax. It's a significant improvement on the original proposal but there are some stings in the tail.

Property versus shares - a practical guide for investors

I’ve been comparing property and shares for decades and while both have their place, the differences are stark. When tax, costs, and liquidity are weighed, property looks less compelling than its reputation suggests.

10 fearless forecasts for 2026

The predictions include dividends will outstrip growth as a source of Australian equity returns, US market performance will be underwhelming, while US government bonds will beat gold.

Latest Updates

Economy

Ray Dalio on 2025’s real story, Trump, and what’s next

The renowned investor says 2025’s real story wasn’t AI or US stocks but the shift away from American assets and a collapse in the value of money. And he outlines how to best position portfolios for what’s ahead.

Superannuation

No, Division 296 does not tax franking credits twice

Claims that Division 296 double-taxes franking credits misunderstand imputation: franking credits are SMSF income, not company tax, and ensure earnings are taxed once at the correct rate.

Investment strategies

Who will get left holding the banks?

For the first time in decades, the Big 4 banks have real competition in home loans. Macquarie is quickly gain market share, which threatens both the earnings and dividends of the major banks in the years ahead.

Investment strategies

AI economic scenarios: revolutionary growth, or recessionary bubble?

Investor focus is turning increasingly to AI-related risks: is it a bubble about to burst, tipping the US into recession? Or is it the onset of a third industrial revolution? And what would either scenario mean for markets?

Investment strategies

The long-term case for compounders

Cyclical stocks surge in upswings but falter in downturns. Compounders - reliable, scalable, resilient businesses - offer smoother, superior returns over the full investment cycle for patient investors.

Property

AREITs are not as passive as you may think

A-REITs are often viewed as passive rental vehicles, but today’s index tells a different story. Development and funds management now dominate earnings, materially increasing volatility and risk for the sector.

Australia’s quiet dairy boom — and the investment opportunity

Dairy farming offers real asset exposure, steady income and long-term growth, yet remains overlooked by investors seeking diversification beyond traditional asset classes.

Sponsors

Alliances

© 2026 Morningstar, Inc. All rights reserved.

Disclaimer
The data, research and opinions provided here are for information purposes; are not an offer to buy or sell a security; and are not warranted to be correct, complete or accurate. Morningstar, its affiliates, and third-party content providers are not responsible for any investment decisions, damages or losses resulting from, or related to, the data and analyses or their use. To the extent any content is general advice, it has been prepared for clients of Morningstar Australasia Pty Ltd (ABN: 95 090 665 544, AFSL: 240892), without reference to your financial objectives, situation or needs. For more information refer to our Financial Services Guide. You should consider the advice in light of these matters and if applicable, the relevant Product Disclosure Statement before making any decision to invest. Past performance does not necessarily indicate a financial product’s future performance. To obtain advice tailored to your situation, contact a professional financial adviser. Articles are current as at date of publication.
This website contains information and opinions provided by third parties. Inclusion of this information does not necessarily represent Morningstar’s positions, strategies or opinions and should not be considered an endorsement by Morningstar.