There is a distinct trend in finance towards increasing complexity over time, including individual security structures, derivatives, the creation of new ‘asset classes’ or portfolio construction techniques that combine these in different ways.
With the pressure on headline fees and costs continuing to mount and as the desire to be seen as increasingly sophisticated or differentiated grows, there is a temptation to use more complex methods of portfolio construction in building multi-manager portfolios. It might be to incorporate ‘cheap’ factor tilts, barbell strategies of passive or semi-passive and high alpha concentrated portfolios or top 20 and ‘ex-20’ mandates. The ability to slice and dice a relatively fixed pool of assets into different constructs is ever present.
As a case study, in 2009 we undertook some analysis to determine whether the increasingly complex methods of constructing Australian equity multi-manager portfolios were, in aggregate after fees and costs, adding value. Our conclusions at that time were:
“Appointing fewer managers, to larger more diversified mandates with an after-tax focus, at a point on the cost curve where average fees are minimised, would result in better after-tax and fee returns at lower aggregate risk. Such structures are simple, require less governance and lower monitoring costs and will make it easier for internal investment teams to aggregate and monitor total portfolio risk.
Complexity is over-rated.”
Our 2009 study was based on all long-only large/broad cap active managers within the Mercer MPA Australian equity universe who had a three-year track record to either January 2000, January 2005 or January 2009. We specifically excluded long short, ethical/SRI or other overly thematic portfolios from the analysis universe (for example, income). Taking the 2009 data, there were 80 managers with a three-year track record. We note that of this 80, by February 2017, only 50 remain (in their current form).
Alpha versus risk in portfolios
While we observe that fees generally increase with the level of expected alpha (and complexity), investors should have a view as to how the reward for risk (sometimes called the ‘information ratio’) might change with increasing alpha. Given the asymmetry of payoffs between managers of assets and their clients, for these higher fees to be ‘worth it’, the information ratio needs to be increasing with the alpha expectation. This is particularly the case for strategies having fixed plus performance fee structures.
These payoffs are represented below (‘alpha’ is the excess return of a manager relative to a market index).
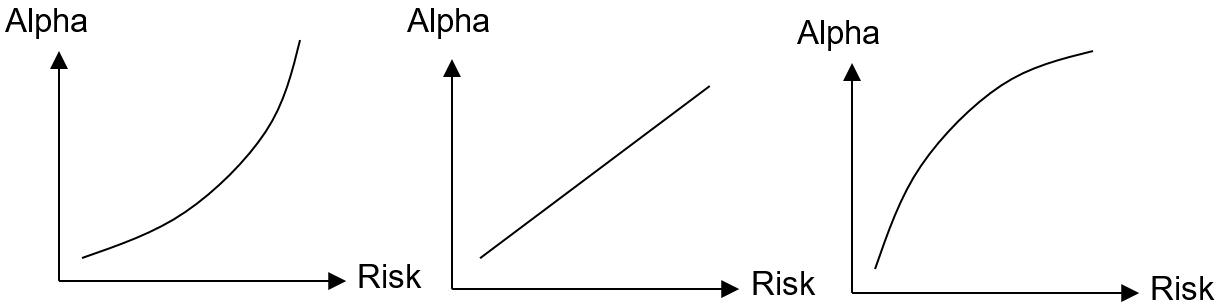
Source: Schroders, stylised charts for illustrative purposes only.
The general view in the industry appears to be that the first chart, and possibly the second, are what most investors expect. However, in our 2009 study we showed that, at least for Australian equity portfolios, the third chart is the reality. That is, as risk rises, there is a disproportionate fall in excess returns.
An update of the analysis and finding the sweet spot
We have now updated this work. The chart below shows, for the 96 long only managers with a three-year track record to February 2017, how their actual average alpha compares with their realised tracking error (ie variation from the index, used here as a measure of risk). While tracking error is not our preferred measure of risk (in fact it is counterintuitive), it remains common, certainly in single asset class portfolio construction. In addition, we have also included data points for the three years to January 2013.
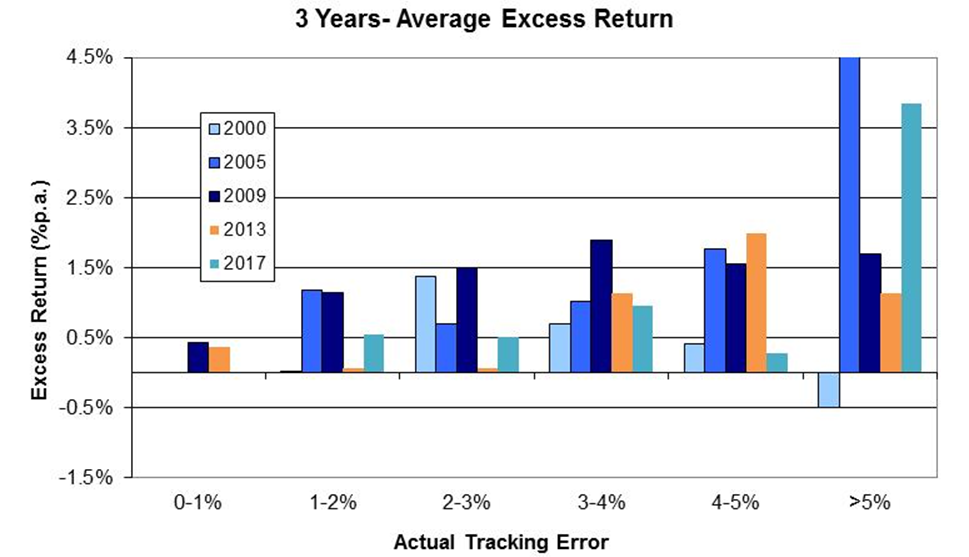
Source: Schroders, Based on Mercer MPA data, all data is gross of fees.
Several observations are worth making:
- The realised level of alpha in nearly all categories and time periods has been positive. Unsurprisingly, the high alpha category has been the most volatile in terms of delivery of excess return.
- The ‘sweet spot’ for consistency remains strategies in the 2-5% realised tracking error range. These tend to be ‘core’ or ‘core plus’ strategies.
- Very high tracking error strategies appear to have done well recently, as they did in the lead up to 2005.
However, we would hasten to add additional points in reviewing the data:
- Survivorship bias (that is, the data is for managers who have ‘survived’ through the period, and perhaps the poor managers no longer exist) in the data is an issue. Several strategies in the 2009 data series have had their track records removed. In particular, for the high-alpha category, the survivorship bias is extreme with only eight of the 18 strategies from 2009 still ‘alive’ by February 2017.
- Of the 80 (long only) strategies that had a three-year track record in 2009, only 50 remained by 2017, yet 46 new strategies have commenced in that time.
- While this analysis looks at average levels of alpha, the most important thing for clients is real dollars of value add, not a percentage. For example, a strategy with $5 billion that has generated 1% of alpha (that is, $50 million) has performed significantly better than a strategy with $100 million of assets that has generated 10% of alpha (that is, $10 million). We note that almost all of the better performing strategies in the high-alpha category are very small in assets or closed to new business.
Constructing a portfolio
What happens when we construct different types of portfolios and allow for the costs of implementation?
In order to understand the likely post-fee impact of alternative strategy configurations, we need to make some broad assumptions about likely fee levels for different mandate types.
For the purpose of this analysis, we have made the following assumptions with respect to average fee levels. While one could ‘argue the numbers’, it is not so much the absolute levels that are important but the relativities between each type.
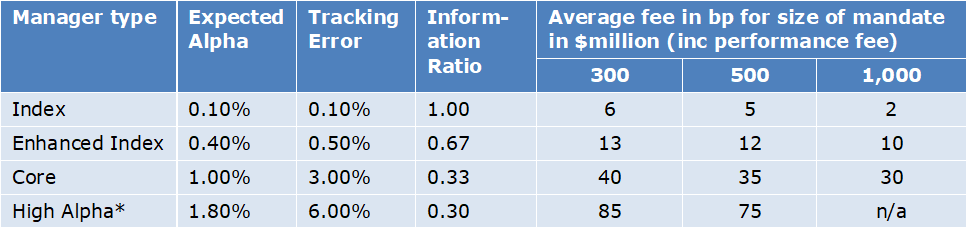
Source: Schroders assumptions. The ‘expected alpha’ amounts have been determined with reference to the averages from our four analysis periods. Enhanced core uses the averages from strategies with 0-2% tracking error, core is 2-4% and high alpha is >4%. We have not allowed for survivorship bias which could reduce the high-alpha numbers further. Many high-alpha strategies have performance fees which can materially skew fees higher in a multi-manager construct. For index managers, we assume a slight positive ‘alpha’.
Assuming a circa $5 billion Australian equity portfolio, the chart below shows the outcomes of different manager configuration options.
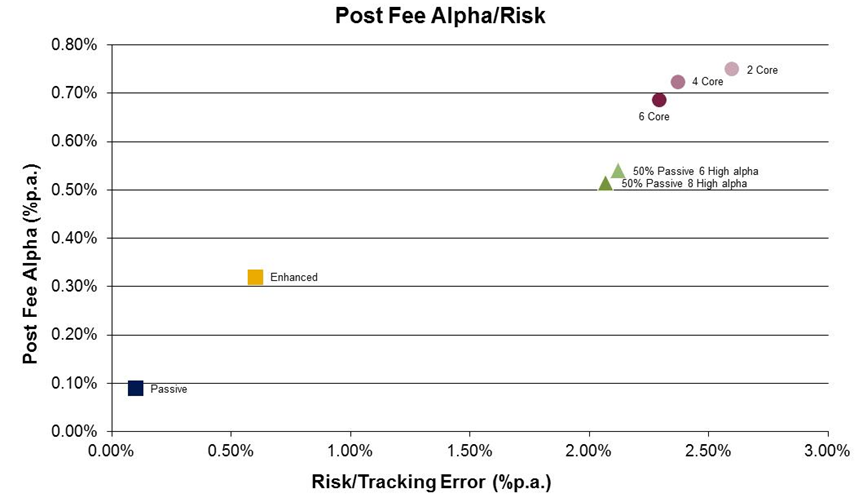
Source: Schroders. The 2, 4, 6 and 8 refer to the number of managers in the various multi-manager constructs.
There appears little benefit to more complex structures and the commensurate increase in fees and governance. By way of sensitivity, fees would have to be about 30% lower than that assumed for the high alpha category to be broadly equivalent to the core structures (assuming no cost to the increased governance and similar levels of survivability).
In 2009, former Chairman of the Federal Reserve, Paul Volker, commented on a conversation with a Nobel Prize-winning economist about the value of financial engineering to the real economy,
“Much to my surprise, he leaned over and whispered in my ear that it does nothing. I asked him what it did do and he said that it moves around the rents in the financial system and besides that it was a lot of intellectual fun.”
Greg Cooper is Chief Executive Officer at Schroders Australia. This article is general information that does not consider the circumstances of any individual.