Although there are more than seven months to go, US midterm elections are already top of mind for politicians. And with good reason. Capital Group believes 2022 could be one of the more consequential midterm elections in US history. Every move in Washington right now is being carefully calculated with the midterms in mind.
But while control of Congress may be at stake, do midterm elections have any effect on US equity markets?
To find out, we examined more than 90 years of data and found that the answer is yes, markets have behaved differently during midterm election years. Here are the five key lessons about investing in this political cycle.
1. The president’s party typically loses seats in Congress
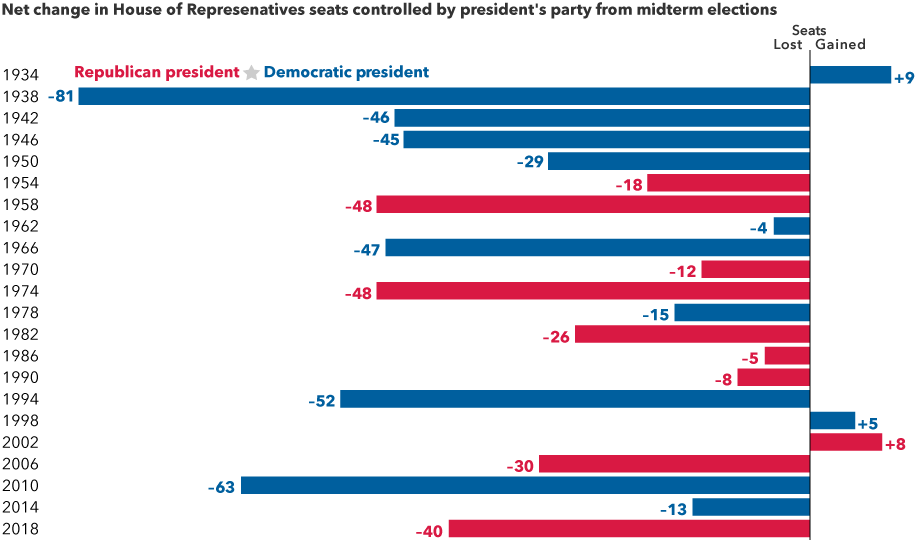
Source: The American Presidency Project, "Seats in Congress Gained/Lost by the President's Party in Mid-Term Elections.”
Midterm elections occur at the midpoint of a four-year presidential term and usually result in the president’s party losing ground in Congress. Over the past 22 midterm elections, the president's party has lost an average 28 seats in the House of Representatives and four in the Senate. Only twice has the president’s party gained seats in both chambers.
Why is this usually the case? First, supporters of the party not in power usually are more motivated to boost voter turnout. Also, the president’s approval rating typically dips during the first two years in office, which can influence swing voters and frustrated constituents to seek change.
Since losing seats is so common, it’s usually priced into the markets early in the year. But the extent of a political power shift and the resulting policy impacts remain uncertain until later in the year, which can explain some of the other trends we’ve uncovered.
2. US market returns tend to be muted until later in midterm years
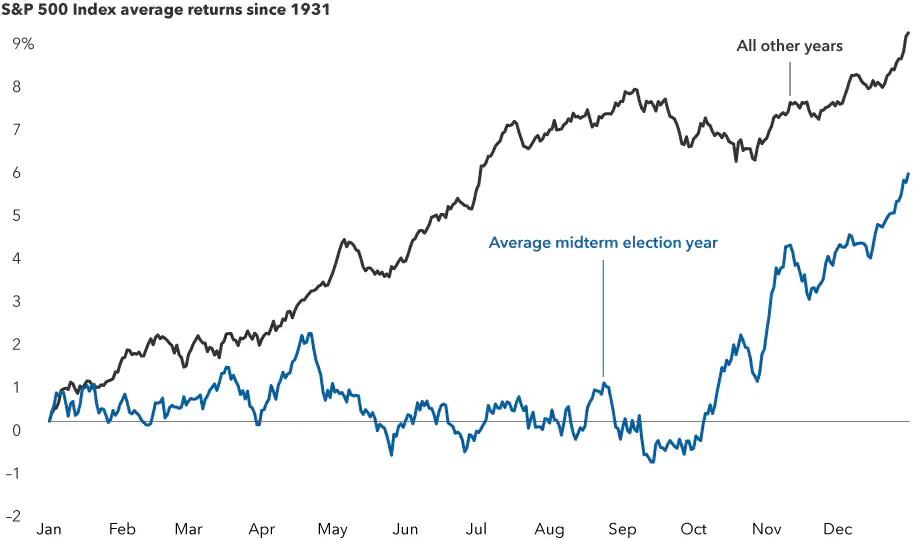
Sources: Capital Group, RIMES, Standard & Poor’s. The chart shows the average trajectory of equity returns throughout midterm election years compared to non-midterm election years. Each point on the lines represents the average year-to-date return as of that particular month and day and is calculated using daily price returns from 1/1/31–12/31/21.
Our analysis of returns for the Standard & Poor’s 500 Composite Index since 1931 revealed that the path of stocks throughout midterm election years differs noticeably compared to all other years.
Since markets typically rise over long periods of time, the average stock movement during an average year should also steadily increase. But what we found was that in the first several months of years with a midterm election, stocks tend to have lower average returns and often gain little ground until shortly before the election.
Markets don’t like uncertainty, and that adage seems to apply here. Earlier in the year there is less certainty about the election’s outcome and impact. But markets tend to rally when results are easier to predict in the weeks before an election, and they continue to rise after the polls close.
Knowing that markets may be choppy in 2022 can be helpful, but investors shouldn’t consider this a reason to sit on the sidelines or try to time the market. The path of stocks varies greatly during each election cycle, and the overall long-term trend of markets has always been positive.
3. Midterm election years have had higher volatility
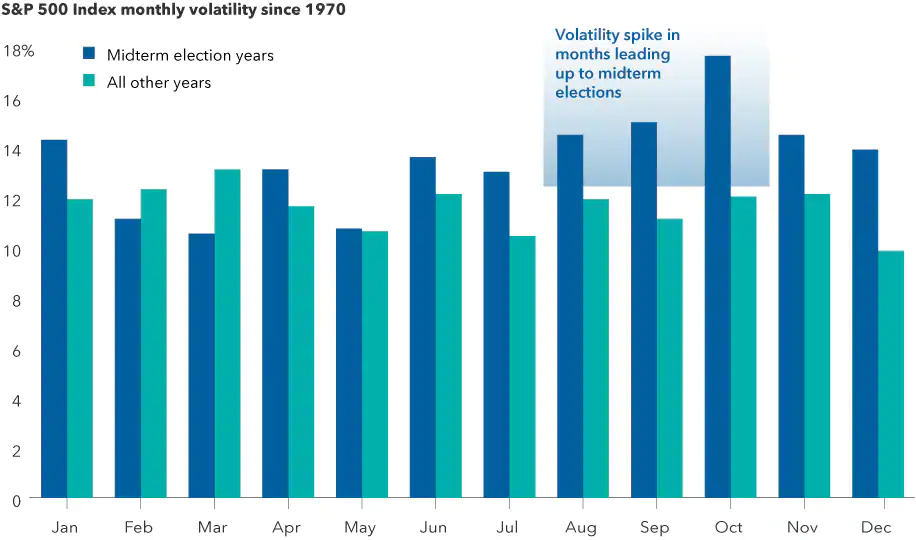
Sources: Capital Group, RIMES, Standard & Poor's. As of 12/31/21. Volatility is calculated using the standard deviation of daily returns for each individual month. Standard deviation is a measure of how returns over time have varied from the average. A lower number signifies lower volatility. Median volatility for each month is displayed on an annualised basis.
Elections can be tough on the nerves. Candidates often draw attention to the country’s problems, and campaigns regularly amplify negative messages. Policy proposals remain uncertain but often target specific industries or companies.
So it may not be surprising that US market volatility is higher in midterm election years, especially in the months leading up to Election Day. Since 1970, midterm years have a median standard deviation of returns of nearly 16%, compared with 13% in all other years.
4. US market returns after midterm elections have been strong
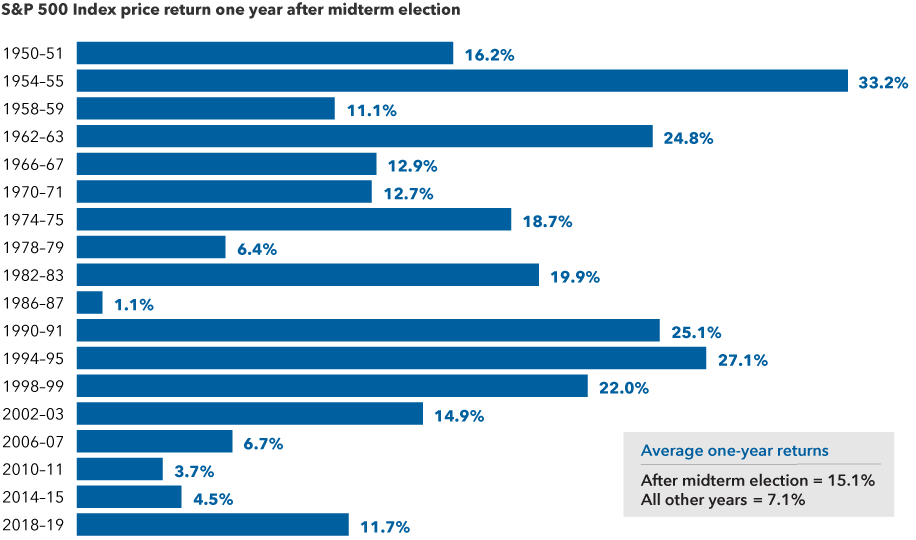
Sources: Capital Group, RIMES, Standard & Poor’s. Calculations use Election Day as the starting date in all election years and November 5th as a proxy for the starting date in other years. Only midterm election years are shown in the chart. As of 12/31/21.
The silver lining for investors is that after such bouts of volatility, markets tend to rebound strongly in subsequent months. And the rally that often starts shortly before Election Day isn’t just a short-term blip. Above-average returns are typical for the full year following the election cycle. Since 1950, the average one-year return following a midterm election is 15%. That’s more than twice the return of all other years during a similar period.
5. US stocks have done well regardless of the makeup of Washington
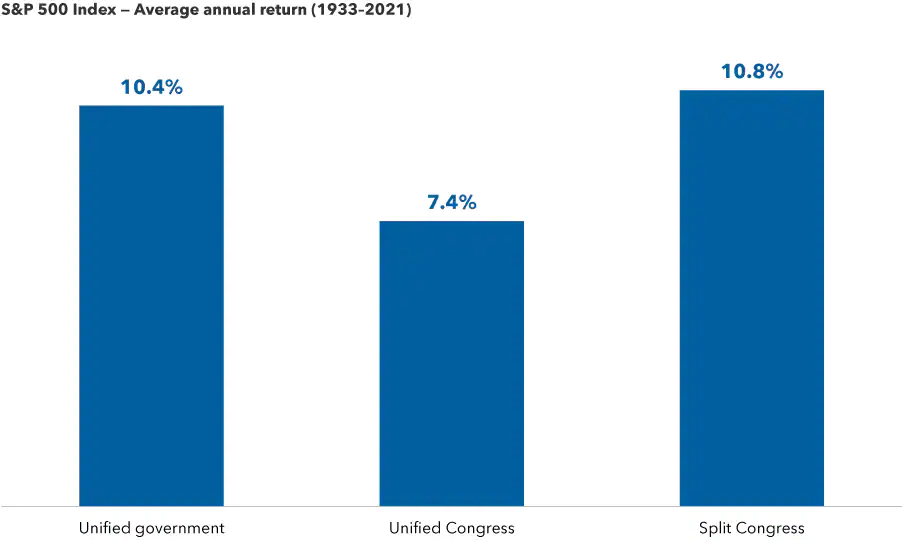
Sources: Capital Group, Strategas. As of December 31, 2021. Unified government indicates control of the White House, House and Senate by the same political party. Unified Congress indicates control of the House and Senate by the same party, but control of the White House by a different party. Split Congress indicates control of the House and Senate by different parties, regardless of White House control.
There’s nothing wrong with wanting your preferred candidate to win, but investors can run into trouble when they place too much importance on election results. That’s because, historically, elections have had very little impact on long-term investment returns.
In 2020, many investors feared the 'blue wave' scenario, or Democratic sweep. But despite these concerns, the S&P 500 Index rose nearly 35% following the 2020 election (through January 12, 2022).
Going back to 1933, markets have averaged double-digit returns in all years that a single party controlled the White House and both chambers of Congress. This is just below the average gains in years with a split Congress, a scenario which many believe is a strong possibility in 2022. Even the 'least good' outcome, when the president’s opposing party controls Congress, notched a solid 7.4% average price return.
What’s the bottom line for investors?
US midterm elections — and politics as a whole — generate a lot of noise and uncertainty. While midterm election years have exhibited these five trends in aggregate over long periods, it is important to remember that each year is different and follows its own path.
There is a good chance of higher volatility in 2022, but no need to fear it. The reality is that long-term equity returns come from the value of individual companies over time. Smart investors would be wise to look past the short-term highs and lows and maintain a long-term focus.
Matt Miller is a Political Economist and Chris Buchbinder is an Equity Portfolio manager at Capital Group, a sponsor of Firstlinks. This article is general information and does not consider the circumstances of any person.
For more articles and papers from Capital Group, click here.