I have read countless books on investing, met an enormous number of financial experts and fund managers, and made pretty much every investing mistake possible.
If I could distil my learnings into one statement, it would be this:
The short term is unknowable, but the long term is inevitable.
Let me share the four best tables from 30 years of investing.
1. The long term is inevitable
The stockmarket has good years and bad, but over the long term there is only one trend, and it is up. Despite this being obvious, I continue to be astounded at how investors behave during ‘bad’ years.
Calendar year 2022 marked the 147th year of trading on Australian exchanges (under various guises). That enormous amount of data provides the clearest guide for anyone willing to learn. During this period, the market (dividends plus share prices) has risen 117 years and declined 30 years. So 79.6% of the time, the market rises. One in five years on average, the market declines.
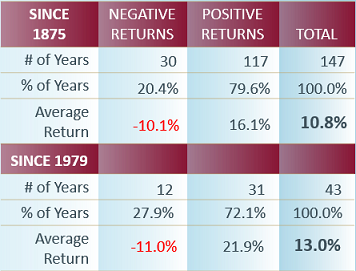
Source: Katana Asset Management
When the market rises, it does so by an average of 16.1%, and when it declines the average is minus 10.1%. When combined, we see that over the past 147 years, the market has averaged a return of 10.8% per annum.
Since we have become more sophisticated and introduced the Accumulation Index in 1979, the data points to an even stronger outcome. Over the 43 years since 1979, the market has risen by an average of 13.0% per annum. And this is despite some seriously scary episodes, including the 1987 stockmarket crash, the 1997 Asian Financial Crisis, the GFC and the fastest fall on record, Covid-19.
2. Volatility is the price you pay for a seat at the table
But of course, in the short term – from year to year – markets are volatile.
The distribution curve is shown below but many investors have failed to grasp the most important aspect.
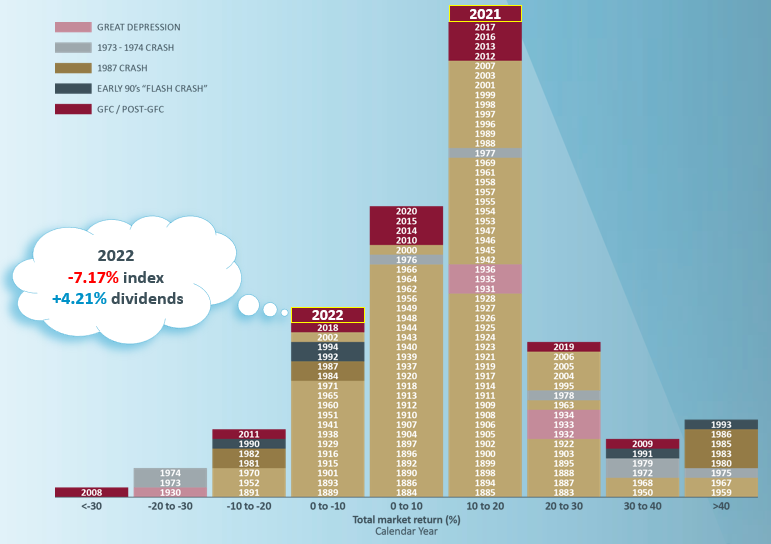
Source: Katana Asset Management
The main point is that crashes are inevitable: be ready and don’t panic at the bottom (the only time to panic is at the top).
There has only been one (calendar) year in the 147-year history where the market fell by 30% or more, in 2008. But if you panicked and sold during that crash, you would have missed an extraordinary recovery. In 2009 the market was up by 39.6% and rose in 11 of the 14 years following the crash, including by 18.8% in 2012, 19.7% in 2013 and 24% in 2019.
Know thyself. If you are prone to doing the wrong thing at the wrong time, stay out of the stockmarket. Or work with a trusted financial adviser who can coach you through such periods.
3. Rolling period returns ... my favourite and best
To better understand how the market behaves over different timeframes, we can break the data into rolling periods. For example, a rolling five-year period is the average return over every five-year period since 1875.
What this table demonstrates is extraordinary.
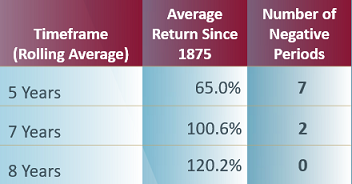
Source: Katana Asset Management
If you had invested your money in the index, turned off your screen, went away and came back five years later, then on average you would have a 65% return. There would have been only seven occasions out of the 143 rolling five-year periods where you would have a negative return.
If you had invested your money in the index, turned off your screen, went away and came back in seven years later, then on average you would have a 100.6% return, and there would have been only two occasions where you would have a negative return.
But even more remarkably ...
If you had invested your money in the index, turned off your screen, went away and came back eight years later, then on average you would have a 120.2% return, and there would have been NO occasions on record where the dividends and capital growth would have been negative.
There is only one long-term trend, and it is up.
4. Wait … here’s a better table!
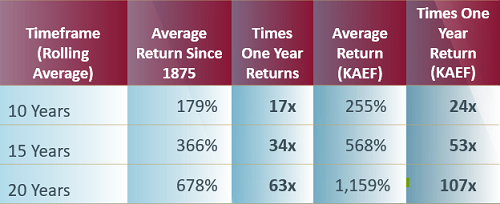
Source: Katana Asset Management
We’ve literally compiled hundreds of tables over the past three decades, and this is our best. There are two critical points.
First, we see even more dramatically, the true power of compounding. Compounding for 10 years, produces the equivalent of 17 one-year returns. Impressive. But compounding for 20 years produces the equivalent of an extraordinary 63 one-year returns!
And second, the importance of generating an extra margin. The Katana Australian Equity Fund has generated an extra 2.7%+ per annum net of all fees for 17 years. If we take a 2.7% per annum margin and compound it over 10, 15 and 20 years, the effects are mind-boggling. Over 10 years, it is the equivalent of 24 one-year returns. Over 20 years, this generates the equivalent of 107 one-year returns. Difficult to believe, but true. Generating an extra 2.7% per annum (net) generates the equivalent of 107 one-year returns versus 63 one-year returns without it.
Timeframe, timeframe, timeframe
If the short term is unknowable and the long-term inevitable, an investor really does need to focus on the long term. If through age or financial circumstance an investor does not have the luxury of a long-term horizon, then they should understand the extra risk that they are taking on.
Remember in the stock market, volatility is the price you pay for a seat at the table. There will be another crash. Guaranteed. If your time horizon is not beyond the next crash, or you panic and do the wrong thing at the wrong time, then discretion may be the better part of valour.
Romano Sala Tenna is Portfolio Manager at Katana Asset Management. This article is general information and does not consider the circumstances of any individual. Any person considering acting on information in this article should take financial advice.
Past performance is not a guarantee of future performance. Stock market returns are volatile, especially over the short term.