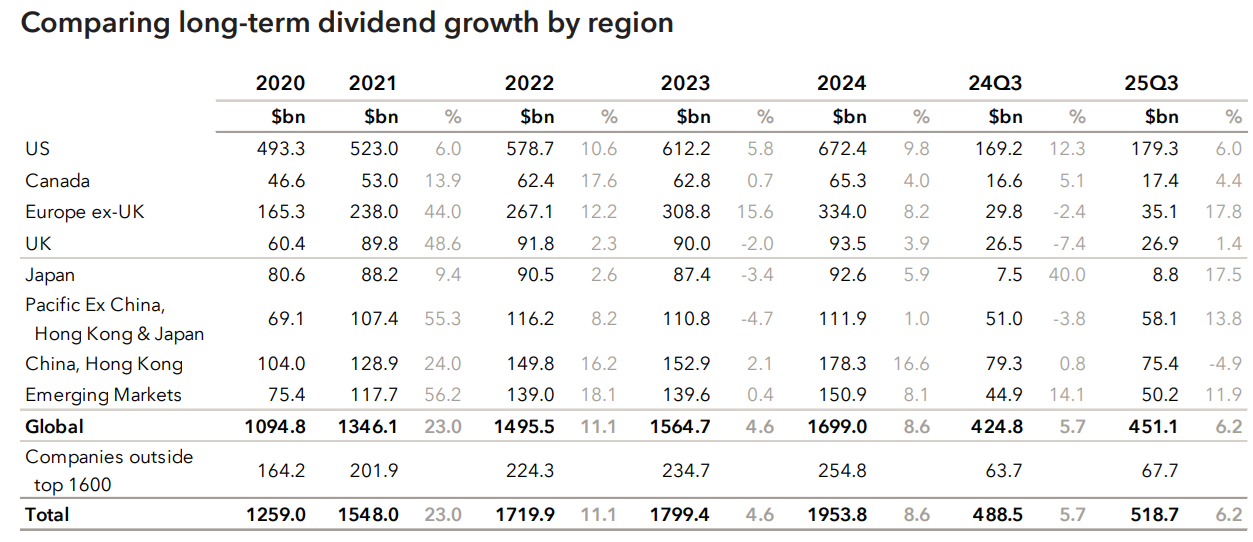
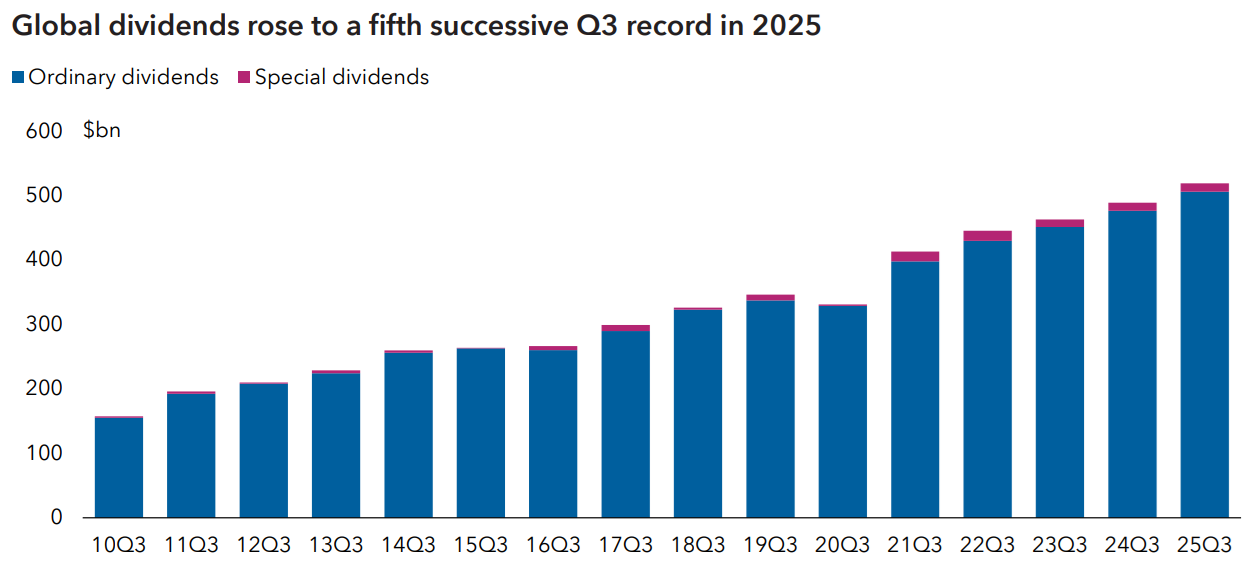
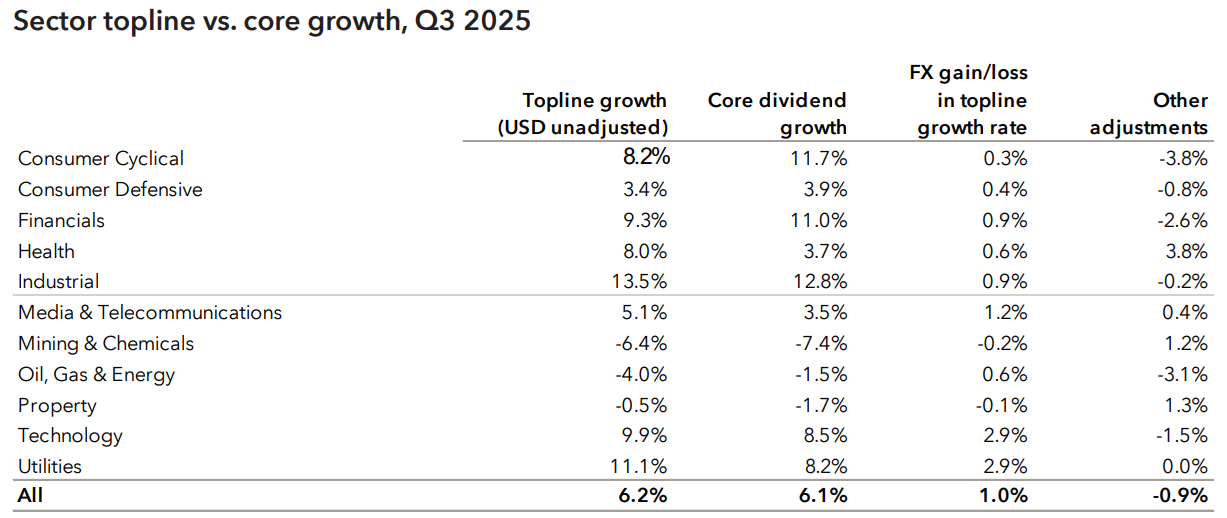
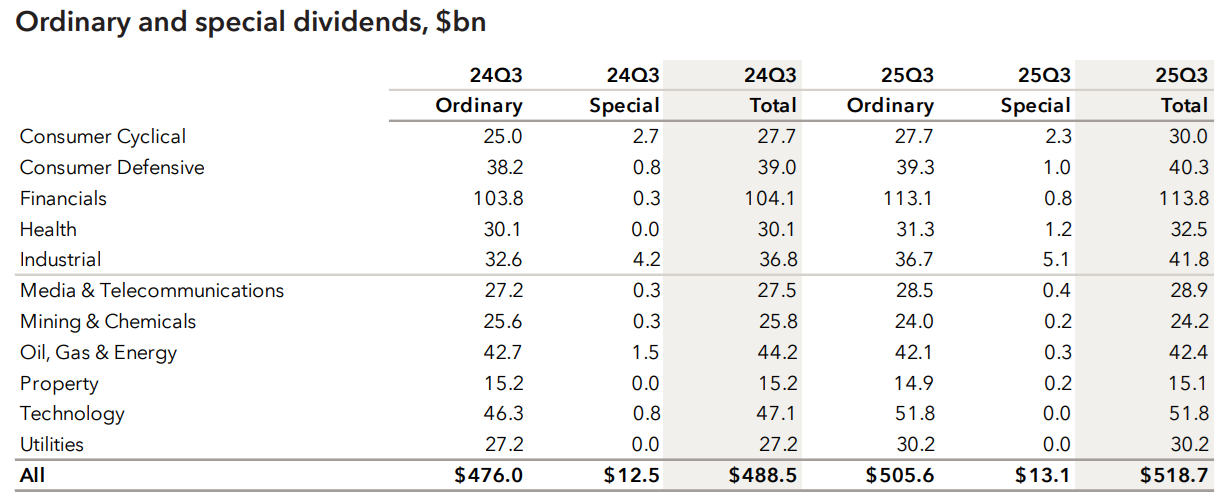
Global dividends continued their impressive run in the third quarter. They rose 6.2% year-on-year to US$518.7 billion on a topline basis, a Q3 record. The core dividend growth rate, which adjusts for one-offs, exchange rates and calendar factors, was very similar at 6.1%, though there was significant divergence between different geographies and sectors. The outcome in the third quarter was a little better than we expected, thanks mainly to greater strength than projected for Taiwan, Hong Kong and Europe ex-UK.
Record payouts in the US came despite a slight slowdown in dividend growth to 5.7% on a core basis. In a relatively quiet season for European dividends, Poland and Spain were responsible for half the region’s double-digit growth, while France and the Netherlands continued to lag behind. The UK also remained in the slow lane.
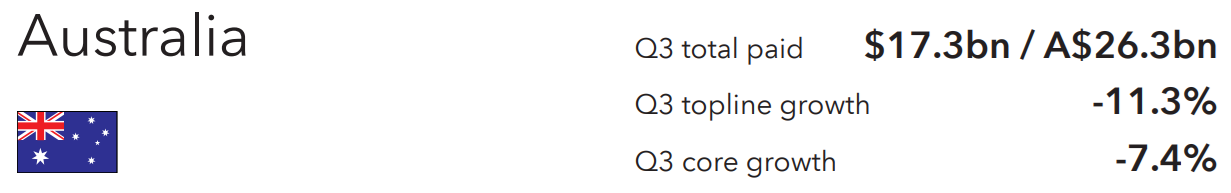
Japan maintained its rapid dividend growth in Q3, but seasonal patterns meant it was not a major growth driver at the global level. Hong Kong’s payouts surged by almost one-sixth in its peak dividend season and there were no cuts among companies in our index. However, in China, there was no growth at all on a core basis and more than one-third of companies reduced their distributions. In the wider Pacific region, Australia remains a weak spot, with payouts in the country down again in Q3. This fall was driven by cuts among mining and energy companies, leaving Australia at the bottom of the global rankings of major markets this year to date.
Note: Figures are in US dollars. Source: Capital Group
Taiwan, however, saw payouts jump by a quarter and there was strong growth in Korea. In contrast, a cut from Singapore Airlines held Singapore’s Q3 growth rate back. Emerging markets delivered rapid growth, thanks, in particular, to India, Saudi Arabia, South Africa and Mexico.
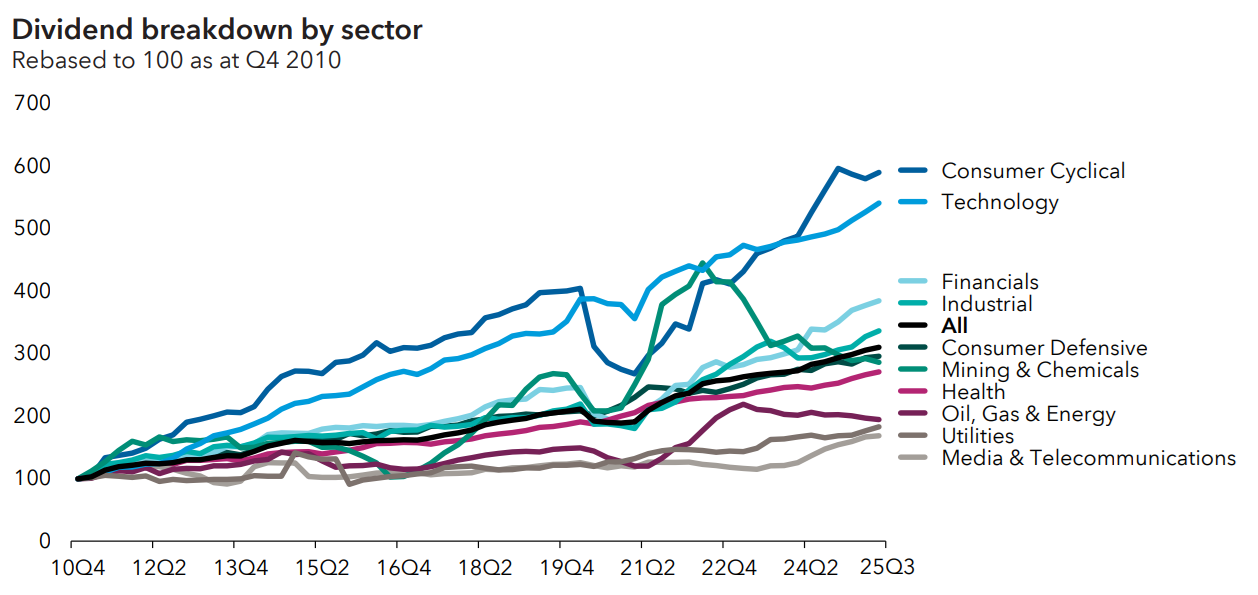
From a sector perspective, almost half the growth in the third quarter came from financials, which increased payouts by 11.0% on a core basis. Insurers showed the fastest growth, while higher banking dividends were a worldwide phenomenon. Software companies in India and the US also made a significant positive contribution to growth. The most notable cut was once again from the mining and chemicals sector, where payments were down 7.4% on a core basis, and energy payouts also fell.
Across the globe, 88% of companies either increased dividends or held them steady in Q3, with median dividend growth standing at 5.7%.
Note: Figures are in US dollars. Source: Capital Group
Sector trends
Almost half the global dividend growth in the third quarter came from financials, which raised dividends by almost US$11 billion year-on-year. Financials' core dividend growth of 11% was almost twice as fast as the all-sector average. The fair wind for banks blew worldwide – every one of the top 11 banking contributors to Q3 growth came from a different market, and only five out of the 92 banks that paid a Q3 dividend made a cut. There were no cuts among the 47 insurers in our index that made a payout in Q3 and there were only very few among general financials. The financial sector, and each of its subsectors, is comfortably on track for record payouts this year.
Software and IT services saw payouts up 17.1% on a core basis, with India and the US dominating the growth tables for the sector. However, semiconductors lagged in the global tables as a big cut from Intel weighed on growth.
In some sectors, just one or two companies made a big difference – for example, the large contribution to Q3 growth made by the transport sector was mainly a function of Evergreen Marine in Taiwan, while in the machinery sector, a quarter of the increase was delivered by Rolls-Royce, which restarted dividends this year after a long suspension.
Source: Capital Group
The most notable cut in Q3 was once again from the mining & chemicals sector. Analyst earnings expectations suggest the mining cycle may now be bottoming out, meaning the drag it has placed on dividends in the last three years may be coming to an end; gold miners already represent a bright spot – without their positive contribution, Q3 growth for the sector would have been -10.3%. Oil dividends were also lower (-1.5%), with a quarter of companies in the sector cutting payouts year-on-year. Dividends from the property sector were dragged lower by cuts in China.
Note: Figures are in US dollars. Source: Capital Group
Australia a laggard
The 7.4% core decline in Australian Q3 dividends was largely a result of steep cuts from mining groups, in particular BHP, and from Woodside Energy. This reflects lower profits in both the mining & chemicals and the oil, gas & energy sectors, which accounted for one-third of Australia’s Q3 dividends. Meanwhile, Australia’s banks, which made up another one-third of the Q3 total, are only increasing dividends very slowly as they already have very high payout ratios – ANZ, for example, made no increase at all; National Australia Bank posted a rise of just 1.2%, while CBA managed 4.0%.
Source: Capital Group
The remaining one-third of companies managed core growth of 3.0%, but this was still modest and not enough to boost the national total significantly. The decline in Australia’s topline rate was more severe than that in the core rate, mainly owing to the weaker Australian dollar compared to Q3 2024. In the first nine months of the year, Australian core dividend growth was -9.0%, the weakest of any major market in our index.
Looking forward
Looking ahead to the fourth quarter, likely ongoing rapid dividend growth in Japan will coincide with a seasonal peak, meaning it will make a more significant contribution than in Q3. European banks remain a bright spot, and we expect to see continued strength in the Pacific region. Emerging markets are much harder to track given erratic payment patterns in key markets, but there may be some significant cuts in the Indian and Brazilian energy sectors, which would impact Q4 growth. The US may see slightly slower dividend growth in Q4 than in the first nine months of the year, based on dividends that had already been announced at the time of writing, but there is scope for this to change as the earnings season unfolds.
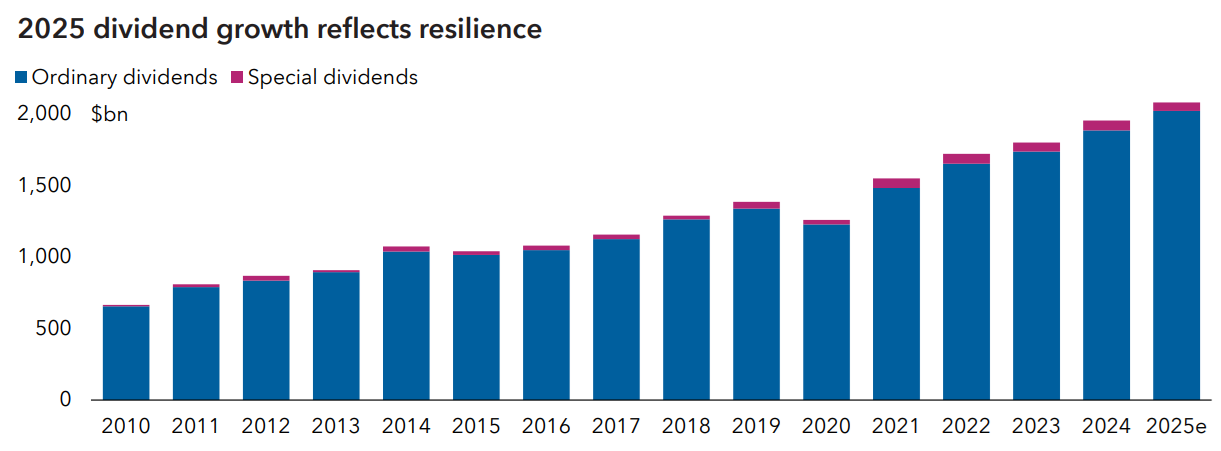
Overall, we expect to see progress continue in the fourth quarter and project total dividend growth in 2025 of 6.4% on a topline basis, to a new record of $2.08 trillion, equivalent to core growth of 5.8%.
2025 has been characterised by heightened volatility, driven by macroeconomic pressures such as tariffs, a softening labour market, and persistent inflation. Looking into 2026, structural tailwinds for global equities remain robust, despite these near-term challenges. Advances in artificial intelligence continue to attract significant investment, while accelerated innovation in health care and an industrial renaissance have supported corporate earnings growth. While short-term volatility is likely to persist, we believe the long-term outlook for active, research-driven equity investing remains compelling. Moreover, in periods of policy and geopolitical uncertainty, companies with a track record of dividend growth can offer portfolios a measure of stability and resilience when markets become turbulent.
Note: Figures are in US dollars. Source: Capital Group
Capital Group Australia is a sponsor of Firstlinks. This article contains general information only and does not consider the circumstances of any investor. Please seek financial advice before acting on any investment as market circumstances can change.
For more articles and papers from Capital Group, click here.
* A quick note on methodology:
The Dividend Watch looks at the dividends the world’s largest 1,600 companies pay to their shareholders. These companies represent around 85% of global market capitalisation as at 31 March 2025. To complete the picture, we top up the figures to 100% by making a few simple assumptions.
Capital Group analysed the dividend payments of the world’s largest 1,600 companies by market capitalisation (as at 31 March 2025), on a free float adjusted basis, using data supplied by Exchange Data International, supplemented by insight from company sources such as annual reports and results announcements and FactSet. FX data is also sourced from FactSet.
Historical data for this same list of companies was compiled back to 2010. In the study, we calculated the topline total paid. Core dividend growth rates were derived by adjusting the topline total for constant exchange rates and by stripping out special dividends and the effect of calendar changes.
Throughout the document, dividend growth has been calculated in US dollars and is illustrated using indexed charts rebased to 100 in Q4 2010, allowing for easy comparison of relative changes over time. All growth rates quoted in the text are year-on-year unless otherwise stated.