The higher the price you pay, the lower your returns. This is a fundamental truth of investing, a law, like gravity, and an impost that cannot be escaped. And yet it is always the case that when future returns are the least attractive, enthusiasm for assets is highest. The dichotomy is best explained by author and economist John Kenneth Galbraith’s definition of a bubble at the beginning of section VII of his 1955 book, The Great Crash 1929:
“At some point in the growth of a boom all aspects of property ownership become irrelevant except for the prospect of an early rise in price. Income from the property, or enjoyment of its use, or even its long run worth is now academic … What is important is that tomorrow or next week market values will rise – as they did yesterday or last week – and a profit can be realised.”
It is when the present value of a future income stream (intrinsic value) is ignored and ‘investing’ is replaced with uninformed speculation about (unjustified) price increases that we should be most concerned.
The conventional understanding of risk is that higher returns require the adoption of higher risks. But when share prices are low, as they were at the bottom of the GFC in late 2008, real risk is relatively low. It’s only the perception of risk that is high.
To complete the circle, I note that Seth Klarman from Baupost Group recently observed:
“When securities prices are high, as they are today, the perception of risk is muted, but the risks to investors are quite elevated.”
Risk today, and why this time is not different
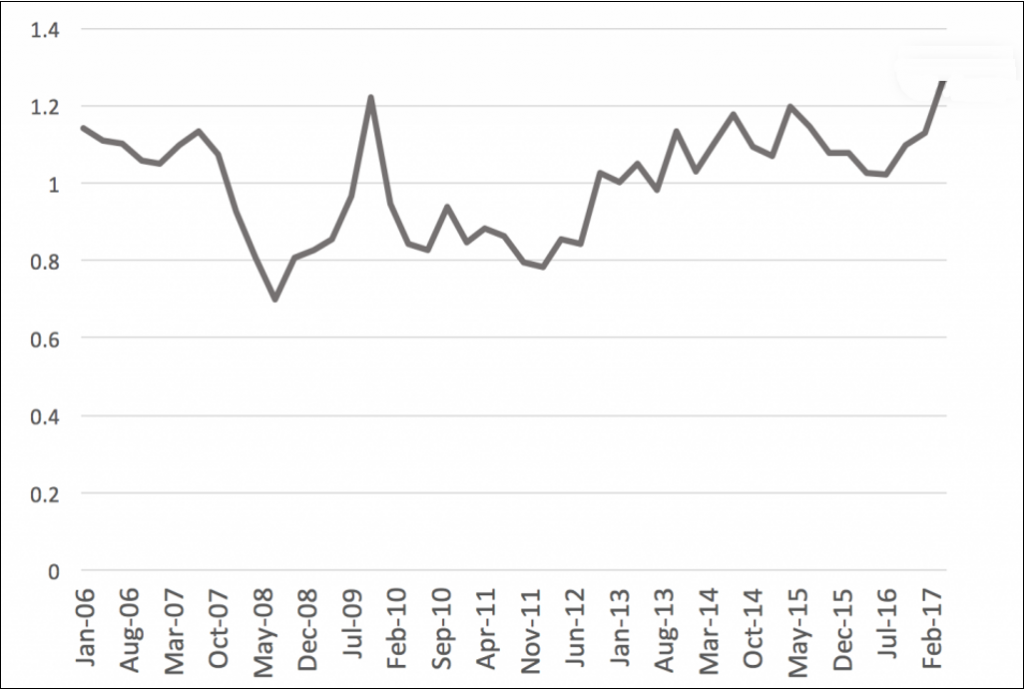
It’s worth putting some numbers around the extent of risks in the market today. While many may respond by suggesting low interest rates justify the numbers, let’s remember that this time is never different. The following chart reveals the S&P/ASX100 is now at its greatest premium, above our intrinsic value estimate, in a decade. This alone suggests that a dose of caution is warranted.
Indicative premium to intrinsic value S&P/ASX100 ex-resources
Source: Montgomery Investment Management Pty Limited
The next chart plots the Cyclically Adjusted Price/Earnings (CAPE) Ratio for the US market, using data from Robert Shiller’s website. This time series goes back to the late 1800s, and being based on 10-year inflation-adjusted trailing average earnings, it removes some cyclical ‘noise’.
Shiller CAPE Ratio S&P500
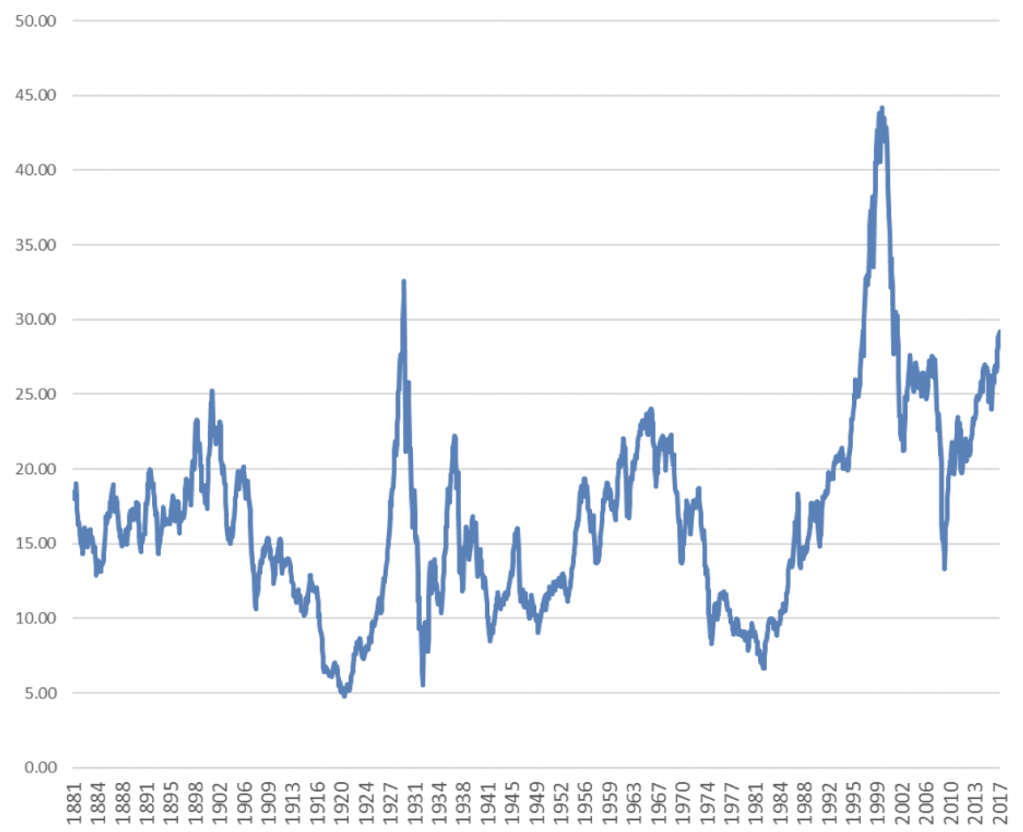
It also shows a market that looks expensive. Only twice since 1881 has the Shiller CAPE been above the current level; the first time just prior to the Great Depression, and the second time just prior to the Tech Wreck.
What about Jeremy Grantham’s ‘new plateau’ statement?
Jeremy Grantham, of GMO fame, recently looked at the S&P500’s PE ratio and proffered the suggestion that this time is indeed different: “very, very different.” A close examination reveals the appearance of a regime change. Between 1970 and 1997, the PE averaged 13.95, but since 1997 the average PE has been 23.36 with higher highs and higher lows being recorded than the pre-1997 period.
In the Shiller CAPE chart above, prior to 1994, a PE above 20 looked to have been the level at which valuation became a concern, with the market mean-reverting and then trading below that level almost 90% of the time.
Since 1994, however, things have been different. In fact, during the post-1994 period the CAPE has been above 20 times for more than 90% of the time. Even in the depths of the GFC, it did not approach the low points seen regularly during the earlier period, and barely recorded any time below its longer-term average.
Grantham’s regime change suggests that we might have a new average – one drawn from the data since 1994 or 1997 – depending on which version of the PE is used – and one that is much higher than any drawn from taking into account the entire period. Such a conclusion is tantamount to what might be described as a new ‘permanently high plateau’. If that expression sounds familiar, it is because the last person who said it was Yale economist Professor Irving Fisher.
It was October 17, 1929 in the New York Times that Fisher wrote;
“Stock prices have reached what looks like a permanently high plateau. I do not feel there will be soon, if ever, a 50 or 60 point break from present levels, such as (bears) have predicted. I expect to see the stock market a good deal higher within a few months.”
That was October 17. Black Thursday occurred on October 24, and the market dropped by 11%, followed four days later by Black Monday, when it fell another 13%, and the next day, Black Tuesday, it lost a further 12%.
As an aside, Fisher was back at it again on November 14, 1929 suggesting:
“The end of the decline of the stockmarket will probably not be long, only a few more days at most.”
As we end financial year 2016/2017, where is Australia?
I am not suggesting we are headed for anything like the circumstances during the Great Depression. I am suggesting that current valuations in Australia are not justified by near-term economic conditions, and more importantly, prospects for profit growth. It does not follow that overvaluation is immediately followed by a crash. However, flying in the face of conventional wisdom, it pays to be more cautious because real risks are higher than perceived risks.
Forward P/E ratio, ASX200 excluding banks and resource companies
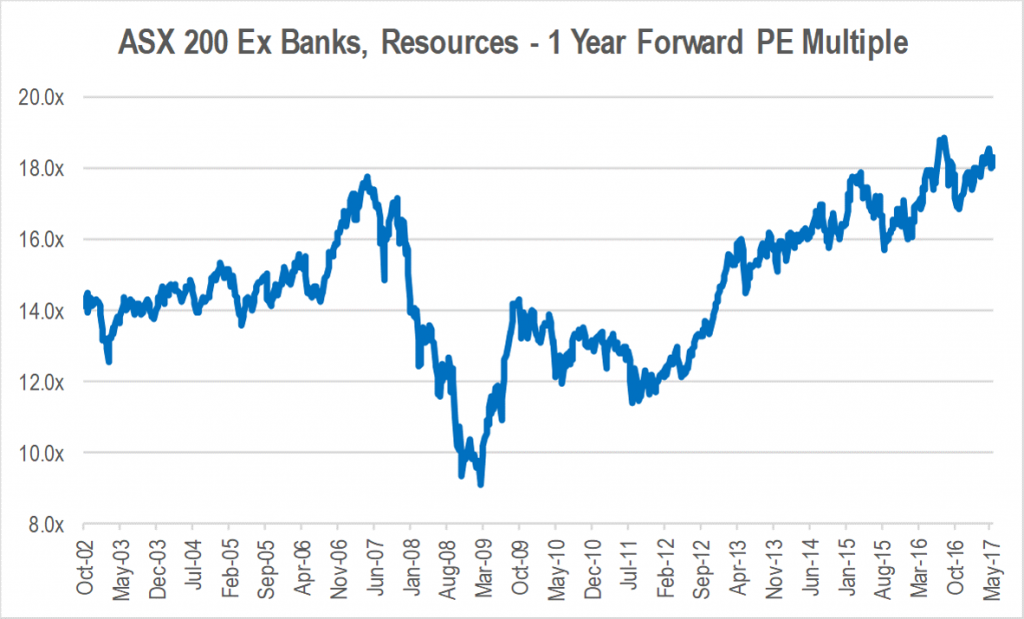
This chart shows at the end of May 2017, the average PE for the group of Australian companies mapped was 18 times. Worryingly, growth in forecast earnings has contributed just 19% of the appreciation in stock prices over the last five years. Fully 81% of the market’s performance over the last five years has simply been due to PE expansion, that is, investors’ willingness to pay more for the same dollar of profits. If the outlook for longer-term earnings growth has improved materially over the same period, such optimism might be warranted. However, like many of our wealthy and experienced business and entrepreneur clients, we see darker tinges to the clouds forming on the horizon.
The average PE today is 7% higher than at the end of October 2007, the pre-GFC peak. Additionally, there are parallels to that period with global interest rates starting to rise following a period of aggressively accommodative monetary policy, and record high levels of debt in the Australian household sector.
The big difference for Australia this time however is that a slowing China, and contracting investment in resources sector capacity growth, will fail to rescue the Australian economy from any broader economic slowdown.
Prior to the GFC, forecast earnings growth was 10% higher than the prior corresponding period, underpinning the PE ratios investors were willing to pay. Today, not only is the market paying 7% more for each dollar of earnings than it was prior to the GFC, but earnings forecasts are only 3% higher than the same time a year ago.
It follows that caution may well be premature but it is nevertheless well founded because the higher the price you pay, the lower your returns and locking in low returns is in nobody’s interest.
Roger Montgomery is Chairman and Chief Investment Officer at Montgomery Investment Management. This article is for general information only and does not consider the circumstances of any individual.