Register For Our Mailing List

Register to receive our free weekly newsletter including editorials.

Home / 484

History lessons: How ‘transitory’ is inflation?

Key points

  • The US Federal Reserve Bank’s expectations for the speed of reverting to 2% inflation levels remains dangerously optimistic.
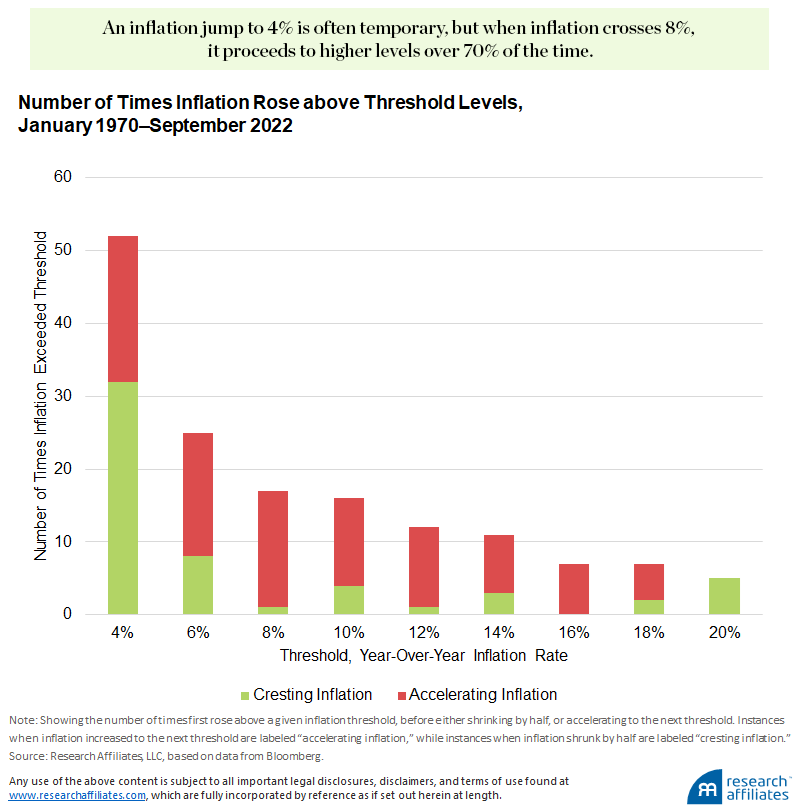
  • An inflation jump to 4% is often temporary, but when inflation crosses 8%, it proceeds to higher levels over 70% of the time.
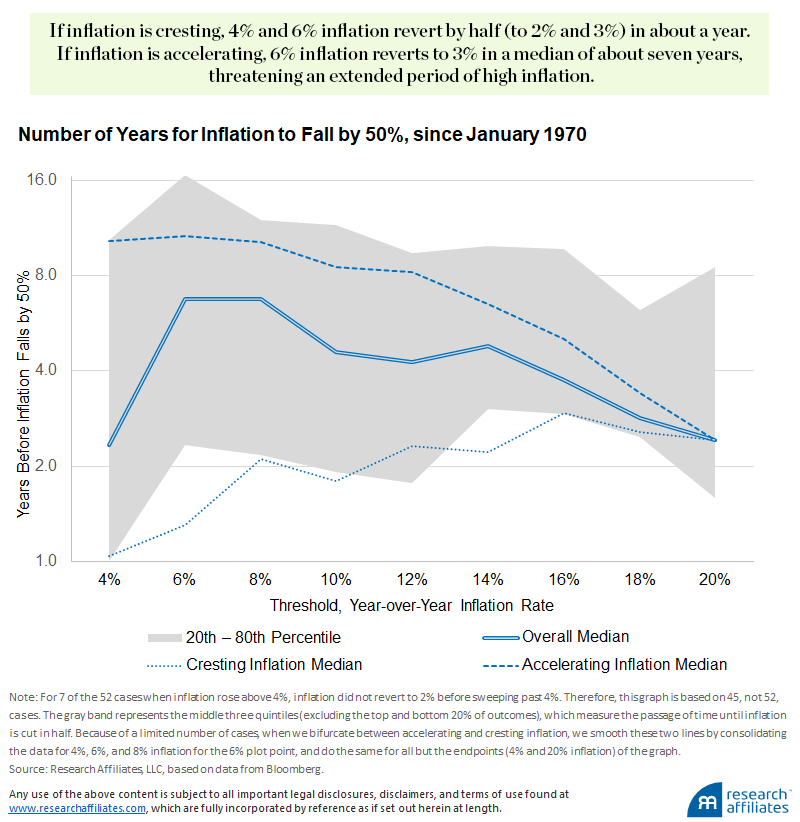
  • If inflation is cresting, inflation levels of 4 or 6% revert by half in about a year. If inflation is accelerating, 6% inflation reverts to 3% in a median of about seven years, threatening an extended period of high inflation.
  • Reverting to 3% inflation, which we view as the upper bound for benign sustained inflation, is easy from 4%, hard from 6%, and very hard from 8% or more. Above 8%, reverting to 3% usually takes 6 to 20 years, with a median of over 10 years.


“Those who cannot remember the past are condemned to repeat it.” – George Santayana

Bad news: History tells us that once the inflation genie is out of the bottle, it can take far longer to return to normal levels than most people realize. Indeed, when Federal Reserve Chair Paul Volker took office in 1979, he pushed the fed funds rate to an unprecedented 20%, 5% above the previous peak inflation rate, the equivalent of today’s Fed embracing double-digit rates. Even so, it took two more years for this extreme policy intervention to cut inflation to half its peak level (to 7%), and over six years to bring inflation to 2%.

In a meta-analysis of 67 published studies on global inflation and monetary policy, Havranek and Ruskan (2013) found that across 198 instances of policy rate hikes of 1% or more, in developed economies the average lag until a 1% decrease in inflation was achieved was between roughly two and four years.

Those who expect inflation to fall rapidly in the coming year may well be correct. But, history suggests that’s a “best quintile” outcome. Few acknowledge the “worst quintile” possibility, in which inflation remains elevated for a decade. Our work suggests that both tails are equally likely, at about 20% odds for each.

When will the inflation genie go back in its bottle?

To answer this question, we studied all cases where inflation surges above 4% in 14 OECD developed-economy countries from January 1970 through September 2022.1 After a country’s inflation rate first exceeds 4%, we observe inflation’s behavior thereafter. As Neville, et.al. (2021) point out, an inflationary surge is not always a bad sign – for example, an increase from -2% to 1% may foreshadow a healthy upturn in the economy.

Here, we test inflationary surges at thresholds of 4% and above, so as to exclude those cases where the economy is recovering from a bout of deflation. For each episode, we measure the time from the first crossing of the thresholds we study (4% to 20%, at intervals of 2%) until the next time inflation retreated to one of two specific targets: in the first test, halfway back to zero or, in the second test, to below 3%. We found 52 instances when inflation rose above 4% for the 14 OECD economies in our sample, of which 6 instances proceed to exceed 20%.2

We observe a useful pattern. When inflation first crosses the 4% threshold, often caused by a temporary exogenous shock, it usually reverses course; in 32 out of 52 cases; over 60% of the time inflation never reaches the next threshold of 6%. We call any case where inflation fails to reach the next threshold cresting inflation. That is the good news.

The bad news is at 6% and higher inflation, cresting inflation is the exception, not the rule: inflation usually marches to the next threshold. When inflation subsequently rises to the next threshold, we call these cases accelerating inflation. Indeed, once the 8% threshold is surpassed, as happened this year in the United States and much of Europe, inflation marched to the next threshold, and often well beyond, over 70% of the time.3 The lesson we should take from this is not that inflation is destined to move to new highs in the months ahead (after all, nearly 30% of the time, it is, in fact, cresting!), but that we dismiss that possibility at our peril.

Note that we are not posing the question, how fast can inflation subside? We know that a singular focus on price stability can rein in inflation almost overnight, as was the case with German hyperinflation in the 1920s, Hungarian hyperinflation in the 1940s, and Zimbabwean hyperinflation in the 2000s. In each instance, central bank control of the printing press was rescinded, and the failed currency was ditched in favor of a broadly trusted medium of exchange, typically gold or the then-prevailing reserve currency.

Money is very simple. It is a medium of exchange to buy or sell labor, goods and services, either contemporaneously or intertemporally (the latter being money’s use as a store of value). Money cannot serve multiple masters. Nevertheless, central bankers seem eager to promote an array of goals they hope to achieve through monetary policy: price stability, full employment, low servicing costs of government debt, bear market disruption, and so forth. When money is asked to serve multiple masters, how long, on average, will a burst of inflation linger?4

How long before inflation falls by half?

In our first test, we estimate the half-life of high inflation: the amount of time it takes for inflation to fall by half, from 4% to 2%, from 6% to 3%, and so forth. For some of the cases of 4% (or higher) inflation, inflation arrives and then recedes; for others, it accelerates further—in some instances, a lot further—before receding.5

The following graph shows the median number of years for inflation to be reduced by half, from the first time it hits one of the inflation thresholds we study. The shaded band representing the middle three quintiles (leaving out the top and bottom 20% of outcomes). The distribution includes cases when inflation reaches the next threshold (accelerating inflation), or does not reach the next threshold before receding (cresting inflation).

We find that once inflation has reached the 4% threshold, at the low end of the grey band, at one year, tells us that 20% of the time it takes a year or less to revert to = 2% inflation (half of the 4% threshold). At the other extreme (at the top of the grey band), 20% of the time, it takes 10 years or more to fall back to 2%!

The median result is a 2½-year wait before a modestly elevated 4% inflation falls below 2%. All of which invites the question: When inflation was already crossing 4% in April 2021 (2% of which was in the prior three months, which was an 8% annualized rate!), what were Powell and Yellen thinking in declaring the inflation transitory? Should we consider a median expectation of 2½ years to revert to a 2% inflation rate as transitory?

The medians for cresting inflation and for accelerating inflation are very different. Cases of cresting inflation dominate the lower reaches of the distribution, while cases of accelerating inflation dominate the top of the distribution. If 4% inflation never makes it to the next threshold of 6%, then this cresting inflation recedes quickly, with a median time of just 1 year to revert to = 2%.

But if inflation is accelerating and proceeds to the next threshold of 6%, and perhaps higher trouble likely awaits. In this situation, with a median of 10 years until the inflation level returns to 2%, the economy could face a protracted period of high inflation. At a 6% threshold, if inflation crests and recedes, the median is 15 months for inflation to fall by half (i.e., to revert to 3%). If instead inflation proceeds to 8% or more, the median time to revert to 3% is nearly 11 years.

When US inflation crossed 4% in April 2021 for the first time since 2008, our study of history might have supported a declaration that the inflation should be transitory. That would only be true, however, if we had been certain that inflation was cresting and would not accelerate to 6% or more. But if inflation moved higher, the median wait to return to 2% inflation would increase tenfold. Then, once inflation crossed 6% in October 2021, if our crystal ball had shown that was the peak, the median expectation would have been to revert to 3% inflation in about 15 months. Otherwise, if inflation rose further (as it did), the median wait for = 3% inflation would be another decade.

Once inflation crossed 8% in March 2022, had we been sure it would not exceed 10%, we could reasonably have expected a return to 4% in about two years. Of course, 4% would still be twice the Fed’s target of 2% and likely would not be reached until March 2024. If the next move from here is to new highs, we would be looking at an average decade-long wait to recede to 4%, which could be extremely painful.

At higher levels of inflation—from crossing the threshold of 6% to crossing 20%—we observe a slight hump-shape in the median half-life peaks at about 7 years when inflation is 6% to 8% (today’s level of inflation!), falling to about 2½ years at an inflation rate of 20%.6 The worst-quintile outcomes, across all levels of inflation, require a wait of anywhere from 8 to 16 years to lower the inflation rate by half from the first time it crosses on of our inflation thresholds.

How long for inflation to revert below 3%?

Few would consider it an applause-worthy win to bring 20% inflation down to 10%. Accordingly, let’s consider another test in which, after inflation first crosses the various thresholds in our analysis (4% to 20%), we declare victory as soon as inflation falls below 3%, an inflation rate most of the citizenry would find tolerable.

It should come as no surprise that the median time to bring 4% inflation down—ever so modestly—to 3% is brief, about 18 months (still perhaps longer than many might expect). But after inflation hits a less-benign 6%, the median number of years to cut inflation to below 3% soars to 7.5 years. From inflation levels of 8% to 20%, the median span required to bring inflation below 3% is surprisingly flat, from 9 to 12 years. This lengthy period may actually be understated because of the handful of cases missing from our dataset in which inflation has failed to return to 3%, to this day.

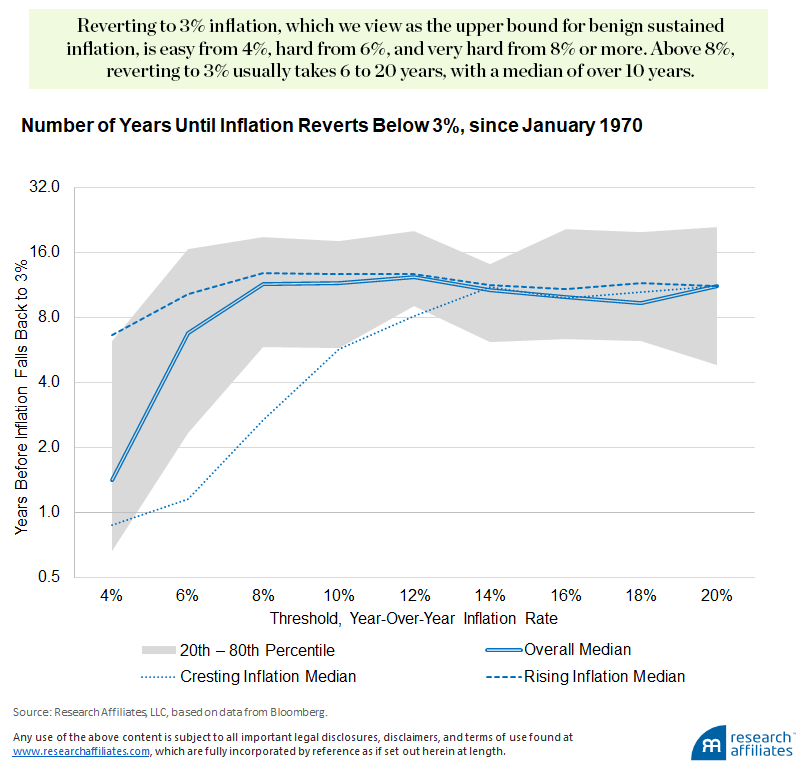
Given the recent US inflation rate, which has been above 6% for the last 12 months and above 8% for the last 7 months, history tells us that the median number of years to reduce inflation below 3% is 10 years, with a 20th to 80th percentile range of 6 to 19 years. How many economists—let alone pundits and policy ‘experts’—have suggested we may have elevated inflation for six years, much less the longer outliers?


Rob Arnott is a Partner and Chair, and Omid Shakernia, PhD is a Partner, Multi-Asset Strategies at Research Affiliates, LLC. This article is general information and does not consider the circumstances of any person. Republished with permission. For footnotes and references, see the full article here.


12 Comments
Fred ramon
December 02, 2022

In my assessment, the question remains, what's the ideal level of real interest rates. in the past there's been negative real returns in Cash since the GFC. Will interest rates normalize at around 1% above inflation (it is currently only at 2.85%)? And also, how high will rates need to go to crush inflation?

Trevor G
November 19, 2022

"history tells us that the median number of years to reduce inflation below 3% is 10 years".

I guess you'd use 10 years as the base rate and work back from that based on circumstances unique to today.

Warren Bird is saying that this time is different. I hope so!

It would be interesting to hear Don Stammers' thoughts.

Mb
November 17, 2022

Great article. One can see why it’s possible to become sceptical of experts ( central banks) and political interference in economics. Masses of new money injected into shut down economies to save jobs, and when inflation ratchets up ( no surprise) we are told that effectively the economy needs to be partially culled and jobs need to be lost. The problem with experts is that they eventually start to believe they actually are.

Rick
November 16, 2022

Whilst I understand Warren’s view, in Australia we have fairly militant trade unions and a sympathetic government pledged to increase wages. If you combine that with the incessant spending of baby boomers flush with cash, my money is on a ten year timeframe. Unless of course Albo introduces some tax initiatives to crimp baby boomers.

DM
November 19, 2022

Fact check. Latest ABS info shows only 14 percent of employed persons are union members.

My reading suggests that many conservative commentators and most economists believe our economy has been constrained, rather than benefitted from, decades of low wage growth.

Wally
November 19, 2022

Hi Rick

Yes, the Franking credit issue will raise its ugly head.

James Gruber
November 16, 2022

Excellent points, thanks Warren.

Warren Bird
November 16, 2022

As Mr Spock would say, with raised eyebrow, "fascinating".

My first reaction to this is that it begs a very important question. In the historical episodes of inflation what was the policy regime? Policy targeting inflation at 3% or less is a relatively recent development in the scheme of things. So to me it's not surprising that in many of the countries that have had inflationary outbreaks in the past it took ages for inflation to fall to 3%. That wasn't the goal most of the time!

Which is a very significant difference to the current episode where the monetary policy response globally has already begun to have an impact. EG the explosion in money growth in the US in 2020 that drove the rise in inflation has already collapsed. (M3 growth in the 3 months to October was less than 2% annualised.) Coupled with the ending of many of the exacerbating supply-side disruptions, that tells me that inflation in the US will be back to 3% during 2023, not in 10 years' time.

So while this statistical analysis is interesting - and certainly cautions policy makers not to be complacent - it's practical usefulness seems limited without further analysis of the monetary policy context (among other things).

Mark Hayden
November 16, 2022

Yes, fascinating. And a good point about regimes' targets, but all, or most, would have wanted low inflation. The big question is, I believe, what is the ideal level of real interest rates. We have had negative real returns in Cash since the GFC. Will interest rates normalise at around 1% above inflation (it is currently only at 2.85%)? And also, how high will rates need to go to crush inflation?

Warren Bird
November 16, 2022

Hi Mark,
I see a big difference between politically "wanting" low inflation and having a policy regime that targets it and sets out to achieve it without politicians interfering. That wasn't built in - and still isn't in many countries - until the 1990s.

As for the "ideal level of real interest rates", there are a couple of elements to that. I suspect that many people (not saying you, but many) seem to think that central banks decide what that is and could adjust rates higher than they have been if they chose to do so. I don't think that's correct. The 'neutral' level of cash rates - real and nominal - is a function of how the demand for and supply of capital is interacting with the economy. In my view, for most of the period since the GFC negative real cash rates have been neutral as the world worked off the excesses that caused the GFC in the first place. They were just beginning to shift back to zero or modest positive real territory when COVID hit and I think that's where they'll settle again. We saw during COVID - especially here in Australia - that rates were set at very easy settings in 2020 and 2021, contributing to burgeoning lending, especially for housing, and a huge jump in credit creation/money supply growth.
The question of 'ideal' thus also boils down to the issue of whether there's an 'ideal' neutral rate. I believe that it is the sign of a healthy structural economy if borrowing and lending generates a real cash rate of around the 1% you mention. But if that isn't where it is then central banks getting the cash rate there won't be ideal as it will be either still stimulatory (if the neutral rate is actually higher) or contractionary (if it's still actually lower).
My personal view is that rates in the US, UK and Europe have done most of the work, if not all, that they need to do, judging by what's happening to their money supply at the moment and the evidence - especially in the US - that inflation has peaked. In Australia, I think we're in a similar situation with the housing market being the 'canary in the coal mine' on this, but we need to see moderate wages growth to ensure that prices of goods and services can come down. I suspect that we'll see the RBA err on the side of running tighter policy, though I'm encouraged by them being the first central bank to have slowed the pace of rate increases.
But to finish back in the context of the article I was commenting on, I don't think it will take 6-10 years for inflation to get back to target levels this time.

Jeff O
November 19, 2022

As Warren highlights - its complicated. The mix of both supply and demand shocks (COVID, climate, hot & cold wars...) and the policy reaction (not just the monetary regime, but fiscal, macro prudential and geopolitical) are all at play. Monetary policy does not deal with many of these issues. And in an underlying sense, potential growth may well have taken another negative hit; so real rates stay at low levels, but risk premia widen and investors should expect lower returns. How will (nominal and real) returns get divided between workers, shareholders and governments? Fair skies n following winds for independent central bankers is necessary but not sufficient to anchor wage and price expectations. Apart from the rate sensitive Australian housing market - Warren's "canary", keep a keen eye on the (global) supply side and governments.

Mark Beardow
November 16, 2022

Hi Warren, I think the yield curve reflects your view, inflation to revert but the cost being a recession. The fed referred to the higher costs in the long run of not preserving price stability - surely a nod to the themes of the RA research. The rba appears more sanguine about the inflation goal, which sets up another interesting test of monetary policy approaches.


Leave a Comment:

RELATED ARTICLES

Why central banks are becoming impotent

The 1970s offer a helpful framework for today's markets

banner

Most viewed in recent weeks

2024/25 super thresholds – key changes and implications

The ATO has released all the superannuation rates and thresholds that will apply from 1 July 2024. Here's what’s changing and what’s not, and some key considerations and opportunities in the lead up to 30 June and beyond.

The greatest investor you’ve never heard of

Jim Simons has achieved breathtaking returns of 62% p.a. over 33 years, a track record like no other, yet he remains little known to the public. Here’s how he’s done it, and the lessons that can be applied to our own investing.

Five months on from cancer diagnosis

Life has radically shifted with my brain cancer, and I don’t know if it will ever be the same again. After decades of writing and a dozen years with Firstlinks, I still want to contribute, but exactly how and when I do that is unclear.

Is Australia ready for its population growth over the next decade?

Australia will have 3.7 million more people in a decade's time, though the growth won't be evenly distributed. Over 85s will see the fastest growth, while the number of younger people will barely rise. 

Welcome to Firstlinks Edition 552 with weekend update

Being rich is having a high-paying job and accumulating fancy houses and cars, while being wealthy is owning assets that provide passive income, as well as freedom and flexibility. Knowing the difference can reframe your life.

  • 21 March 2024

Why LICs may be close to bottoming

Investor disgust, consolidation, de-listings, price discounts, activist investors entering - it’s what typically happens at business cycle troughs, and it’s happening to LICs now. That may present a potential opportunity.

Latest Updates

Shares

20 US stocks to buy and hold forever

Recently, I compiled a list of ASX stocks that you could buy and hold forever. Here’s a follow-up list of US stocks that you could own indefinitely, including well-known names like Microsoft, as well as lesser-known gems.

The public servants demanding $3m super tax exemption

The $3 million super tax will capture retired, and soon to retire, public servants and politicians who are members of defined benefit superannuation schemes. Lobbying efforts for exemptions to the tax are intensifying.

Property

Baby Boomer housing needs

Baby boomers will account for a third of population growth between 2024 and 2029, making this generation the biggest age-related growth sector over this period. They will shape the housing market with their unique preferences.

SMSF strategies

Meg on SMSFs: When the first member of a couple dies

The surviving spouse has a lot to think about when a member of an SMSF dies. While it pays to understand the options quickly, often they’re best served by moving a little more slowly before making final decisions.

Shares

Small caps are compelling but not for the reasons you might think...

Your author prematurely advocated investing in small caps almost 12 months ago. Since then, the investment landscape has changed, and there are even more reasons to believe small caps are likely to outperform going forward.

Taxation

The mixed fortunes of tax reform in Australia, part 2

Since Federation, reforms to our tax system have proven difficult. Yet they're too important to leave in the too-hard basket, and here's a look at the key ingredients that make a tax reform exercise work, or not.

Investment strategies

8 ways that AI will impact how we invest

AI is affecting ever expanding fields of human activity, and the way we invest is no exception. Here's how investors, advisors and investment managers can better prepare to manage the opportunities and risks that come with AI.

Sponsors

Alliances

© 2024 Morningstar, Inc. All rights reserved.

Disclaimer
The data, research and opinions provided here are for information purposes; are not an offer to buy or sell a security; and are not warranted to be correct, complete or accurate. Morningstar, its affiliates, and third-party content providers are not responsible for any investment decisions, damages or losses resulting from, or related to, the data and analyses or their use. To the extent any content is general advice, it has been prepared for clients of Morningstar Australasia Pty Ltd (ABN: 95 090 665 544, AFSL: 240892), without reference to your financial objectives, situation or needs. For more information refer to our Financial Services Guide. You should consider the advice in light of these matters and if applicable, the relevant Product Disclosure Statement before making any decision to invest. Past performance does not necessarily indicate a financial product’s future performance. To obtain advice tailored to your situation, contact a professional financial adviser. Articles are current as at date of publication.
This website contains information and opinions provided by third parties. Inclusion of this information does not necessarily represent Morningstar’s positions, strategies or opinions and should not be considered an endorsement by Morningstar.