Exchange Traded Funds (ETFs) increasingly come in different shapes and sizes and offer efficient access to more asset classes and sectors than ever before. Growth has been rapid. Of the 150 Exchange Traded Products on the ASX, 80 have been listed since 1 January 2013. This is good news, because they usually bring access at a reduced cost compared to other investment vehicles. ETFs now play an important role in investment portfolios, confirmed by the increase in usage and popularity.
Investors need to understand ETF transparency better
As a research house, we contend that ETF selection processes and criteria need to move to another level beyond the current simplistic approach. Factors like funds under management (FUM), age of fund, performance (relative or otherwise), tracking error, issuer confidence, fees, ease of compliance, platform access et al are all, in our view, only the basics.
More work needs to be done to fully understand ETFs and the differences between them. A focus on only the basics misses too much critical information.
Fortunately, the transparency of underlying assets in ETFs allows a much deeper analysis, such as the sector and geographic allocations of each fund. Additionally, by applying the traditional tools of security analysis to each underlying constituent, we can develop a view of a fund’s investment potential based on fundamentals such as earnings growth and valuation multiples. This is a forward-looking approach.
ETF selection should be about building the appropriate research-based ‘investment case’ that matches an investment criteria. Our approach facilitates this for example by distinguishing which funds are most appropriate for a ‘growth at a reasonable price’-type investor versus which funds are better suited to an income-oriented investor.
As an example, a ‘plain vanilla’ equity ETF is simply a basket of equities that seeks to track a given index. We can calculate a detailed series of equities-specific data points (e.g., earnings growth, valuation multiples) as well as the investment exposure the fund holder receives. From there, we can begin to compare ETFs from within their peer groups and even across peer groups.
Under the hood: investing in Europe via ETFs
For example, within the ‘Europe’ peer group, Australian investors can access five equity-based options, one of which is hedged back to the Australian dollar. These come from five different issuers and track five different indices, as shown in Table 1.
Table1: Peer group of European ETFs in Australia
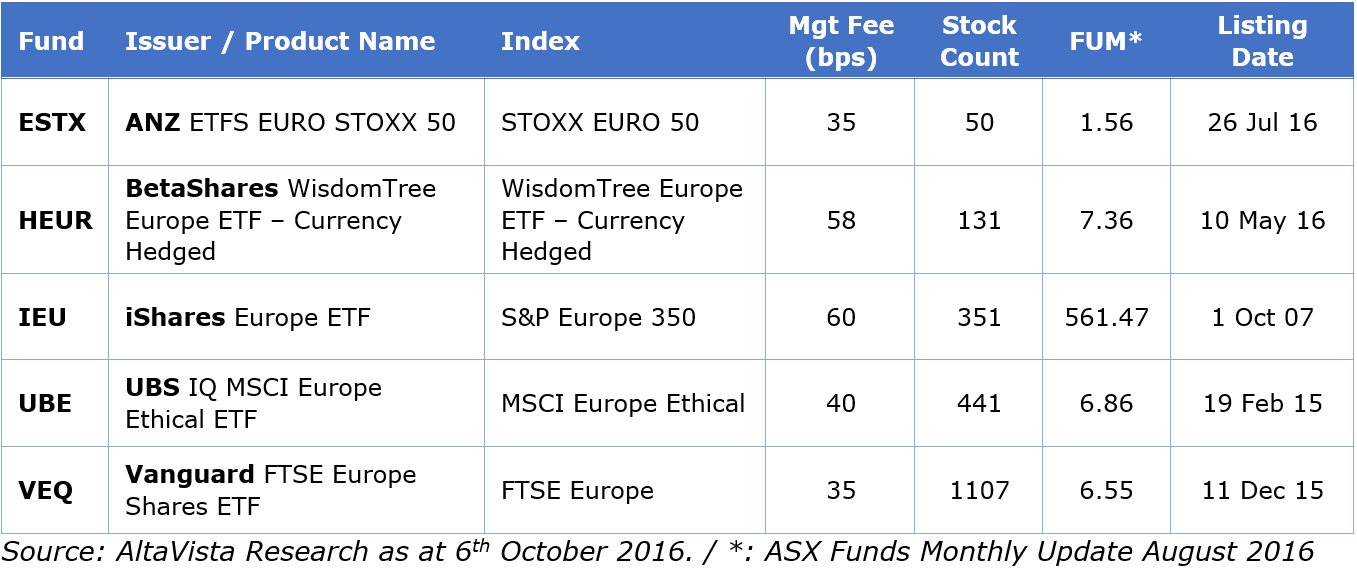
From this data, observations may conclude that older funds may generally have large and sticky Funds Under Management though they may be relatively expensive. Fees can range greatly, with younger funds generally being cheaper. There’s also a premium to pay for hedging and the stock count within each fund varies widely.
When we check the underlying assets, we find all five funds have at least some exposure to each of the ten major sectors, and each is reasonably well diversified, which is not always the case with ETFs. Still, there is plenty of variation, with HEUR offering little exposure to Energy at just 1.4% versus 7.4% for ESTX. For Consumer Discretionary they flip places, with HEUR at 18.3% of assets compared with 10.5% for ESTX.
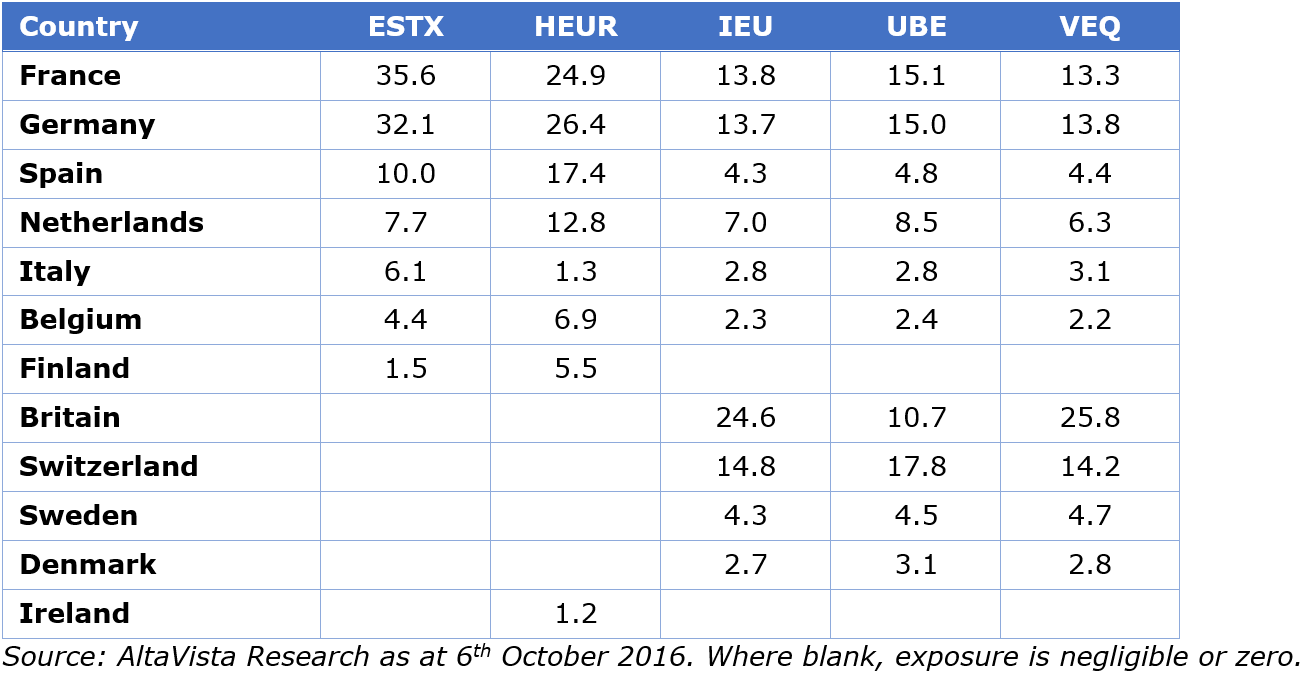
Among country exposures the differences can be significant (Table 2). For example, while IEU and VEQ put about one-quarter of assets in Great Britain, ESTX and HEUR have none. Depending on how Brexit proceeds, that’s likely to have a big difference in returns!
Table 2: Major country exposures of European ETFs
We begin to see that the different rules of each index result in difference exposures. To quantify exactly how similar (or dissimilar) one fund is from another, we introduce Overlap Analysis, which measures the extent to which the positions in each ETF are identical.
Table 3: Overlap analysis of European ETFs
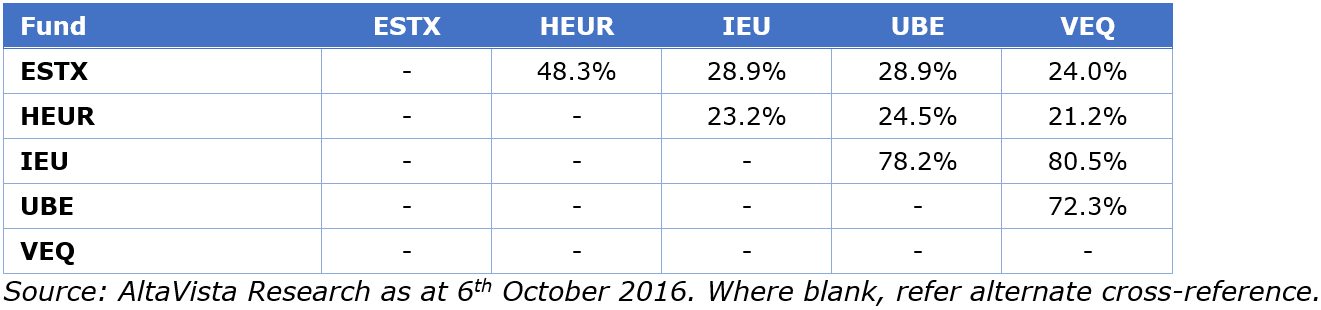
With ESTX as a reference, the overlap with HEUR is 48.3%, meaning nearly half of the fund’s positions are identical. This is important because differences in returns can only be generated from the portion of each portfolio which is distinct.
The more similar one fund is to another, the more important price becomes as a differentiator between products. For example, UBE has 78.2% overlap with IEU, and 72.3% with VEQ. This analysis cuts through sector and country allocation data and identifies an ETF’s ‘value for money’. It is also useful in comparing ‘smart beta’ products to the more traditional pure index ETFs.
Building the investment case
There’s more though to ETF selection than sector and country allocations, fees, past performance – real or back-tested – and other minor preferences. A detailed examination of the investment fundamentals is required to build a solid investment case. Table 4 has some important fundamental factors and valuation metrics, as well as the ALTAR Score™ - our proprietary measure of an ETF’s overall investment merit (like any rating, investors should consider it alongside other criteria when making a fund selection). Our calculations are based on reported results and consensus estimates for each underlying security in an ETF.
Table 4: Investment fundamentals and valuation metrics
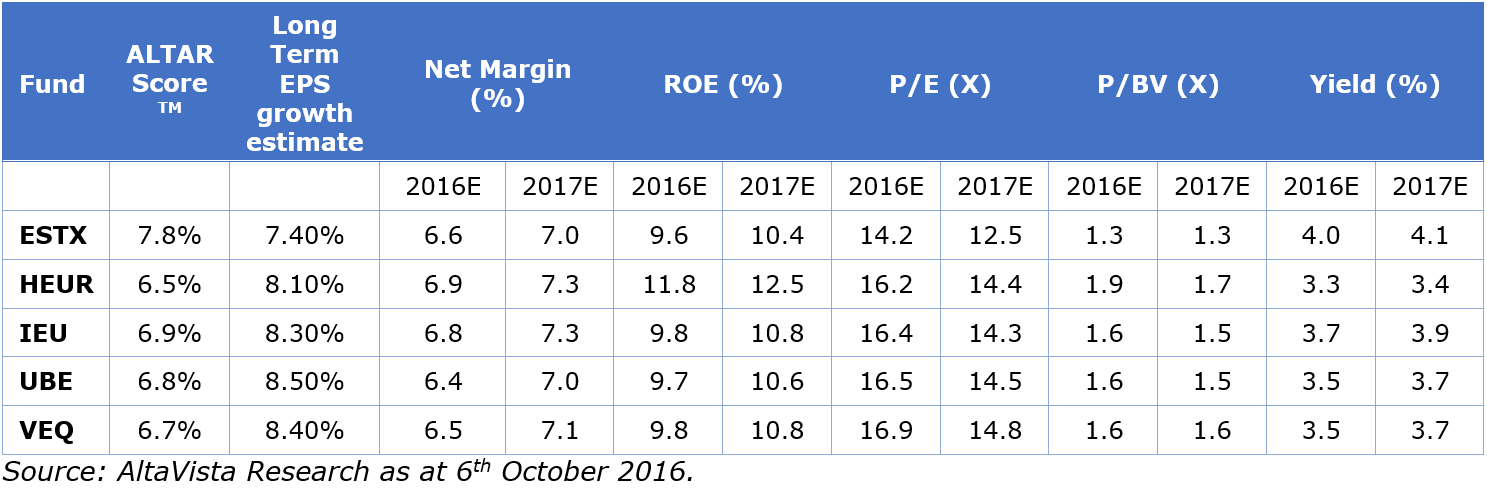
Importantly, the data points above give investors more information on which to make a fund selection. There are usually trade-offs in fundamental data when selecting ETFs. The ALTAR Score™ is not the only thing to look at. For example, superior Net Margins and ROE of the underlying stocks bodes well for the investment characteristics of HEUR, although its higher Price to Book Value (P/BV) impacts yield (which may show the underlying stocks are in favour with current investors).
Understanding the trade-offs
Investing in ETFs — as with almost everything else — involves trade-offs. Table 4 illustrates some of the trade-offs that result between attractive valuations and profitability and growth. The beauty here is that the transparency of an ETF shows those trade-offs clearly. With the appropriate fundamental investment data and selection tools, more informed investment decisions can be made, ultimately creating a better match between an investor’s objectives and the available funds. If you invest in ETFs, as an individual, an advisor, a robo, a super fund, whatever your stripes: what criteria do you value?
Michael Turner is Head of Sales & Corporate Development at AltaVista Research, which is based in the US and has been operating in Australia since 2008. As a specialist ETF researcher, AltaVista covers 1,100 ETFs in the US valued at some USD2.15 trillion. In Australia, research covers 104 equities and fixed income ETFs. This article is general information and does not consider the needs of any individual.