Register For Our Mailing List

Register to receive our free weekly newsletter including editorials.

Home / 26

Investing against the herd, Part 3, Testing the theory

Part 1 of ‘Investing against the herd’ focussed on resisting the emotional responses which are natural instincts for most investors. In part 2, we confirmed consumer sentiment is indeed at its maximum after a period of strong share market performance – and just before the fall.

In Part 3, we test the theory that if we invested against the herd by selling some of our shares when sentiment is bullish, and buying more shares when sentiment is bearish, then we ought to be able to avoid some of the buy-high, sell-low mistakes and be better off in the long run. You may be surprised to find out just how much money you could be losing or making by following the herd.

We look at three theoretical portfolios from September 1974 when the Westpac Consumer Sentiment Surveys were first published.

The first portfolio is a ‘passive benchmark’ portfolio that consists of 50% shares and 50% cash, and is re-balanced back to this 50/50 asset mix at the end of each month. All dividends and interest are re-invested.

In addition, we also run two active portfolios: a ‘follow the herd’ portfolio and an ‘against the herd’ portfolio.

These active portfolios also have a neutral 50/50 shares/cash asset allocation, but the weights of shares can range between +/- 20% from neutral (ie can range from 70% weight of shares to 30% weight for shares), depending on whether the general population is relatively bullish or bearish according to the national consumer sentiment surveys.

  • In the active ‘follow the herd’ portfolio, the asset allocation for the following month is:

-      70%/30% shares/cash (ie over-weights shares) if the ‘Economic conditions for next 12 months’ index level is above 100 (ie consumers are relatively bullish about the next 12 months); and

-      30%/70% shares/cash (ie under-weights shares) if the ‘Economic conditions for next 12 months’ index level is below 100 (ie consumers are relatively bearish about the next 12 months).

  • In the active ‘against  the herd’ portfolio, the asset allocation for the following month is the opposite:

-      30%/70% shares/cash (ie under-weights shares) if the “Economic conditions for next 12 months” index level is above 100 (ie consumers are relatively bullish about the next 12 months); and

-      70%/30% shares/cash (ie over-weights shares) if the “Economic conditions for next 12 months” index level is below 100 (ie consumers are relatively bearish about the next 12 months).

Therefore, the active portfolios are making moderate (20%) tilts toward or away from shares based on the weight of consumer sentiment each month.

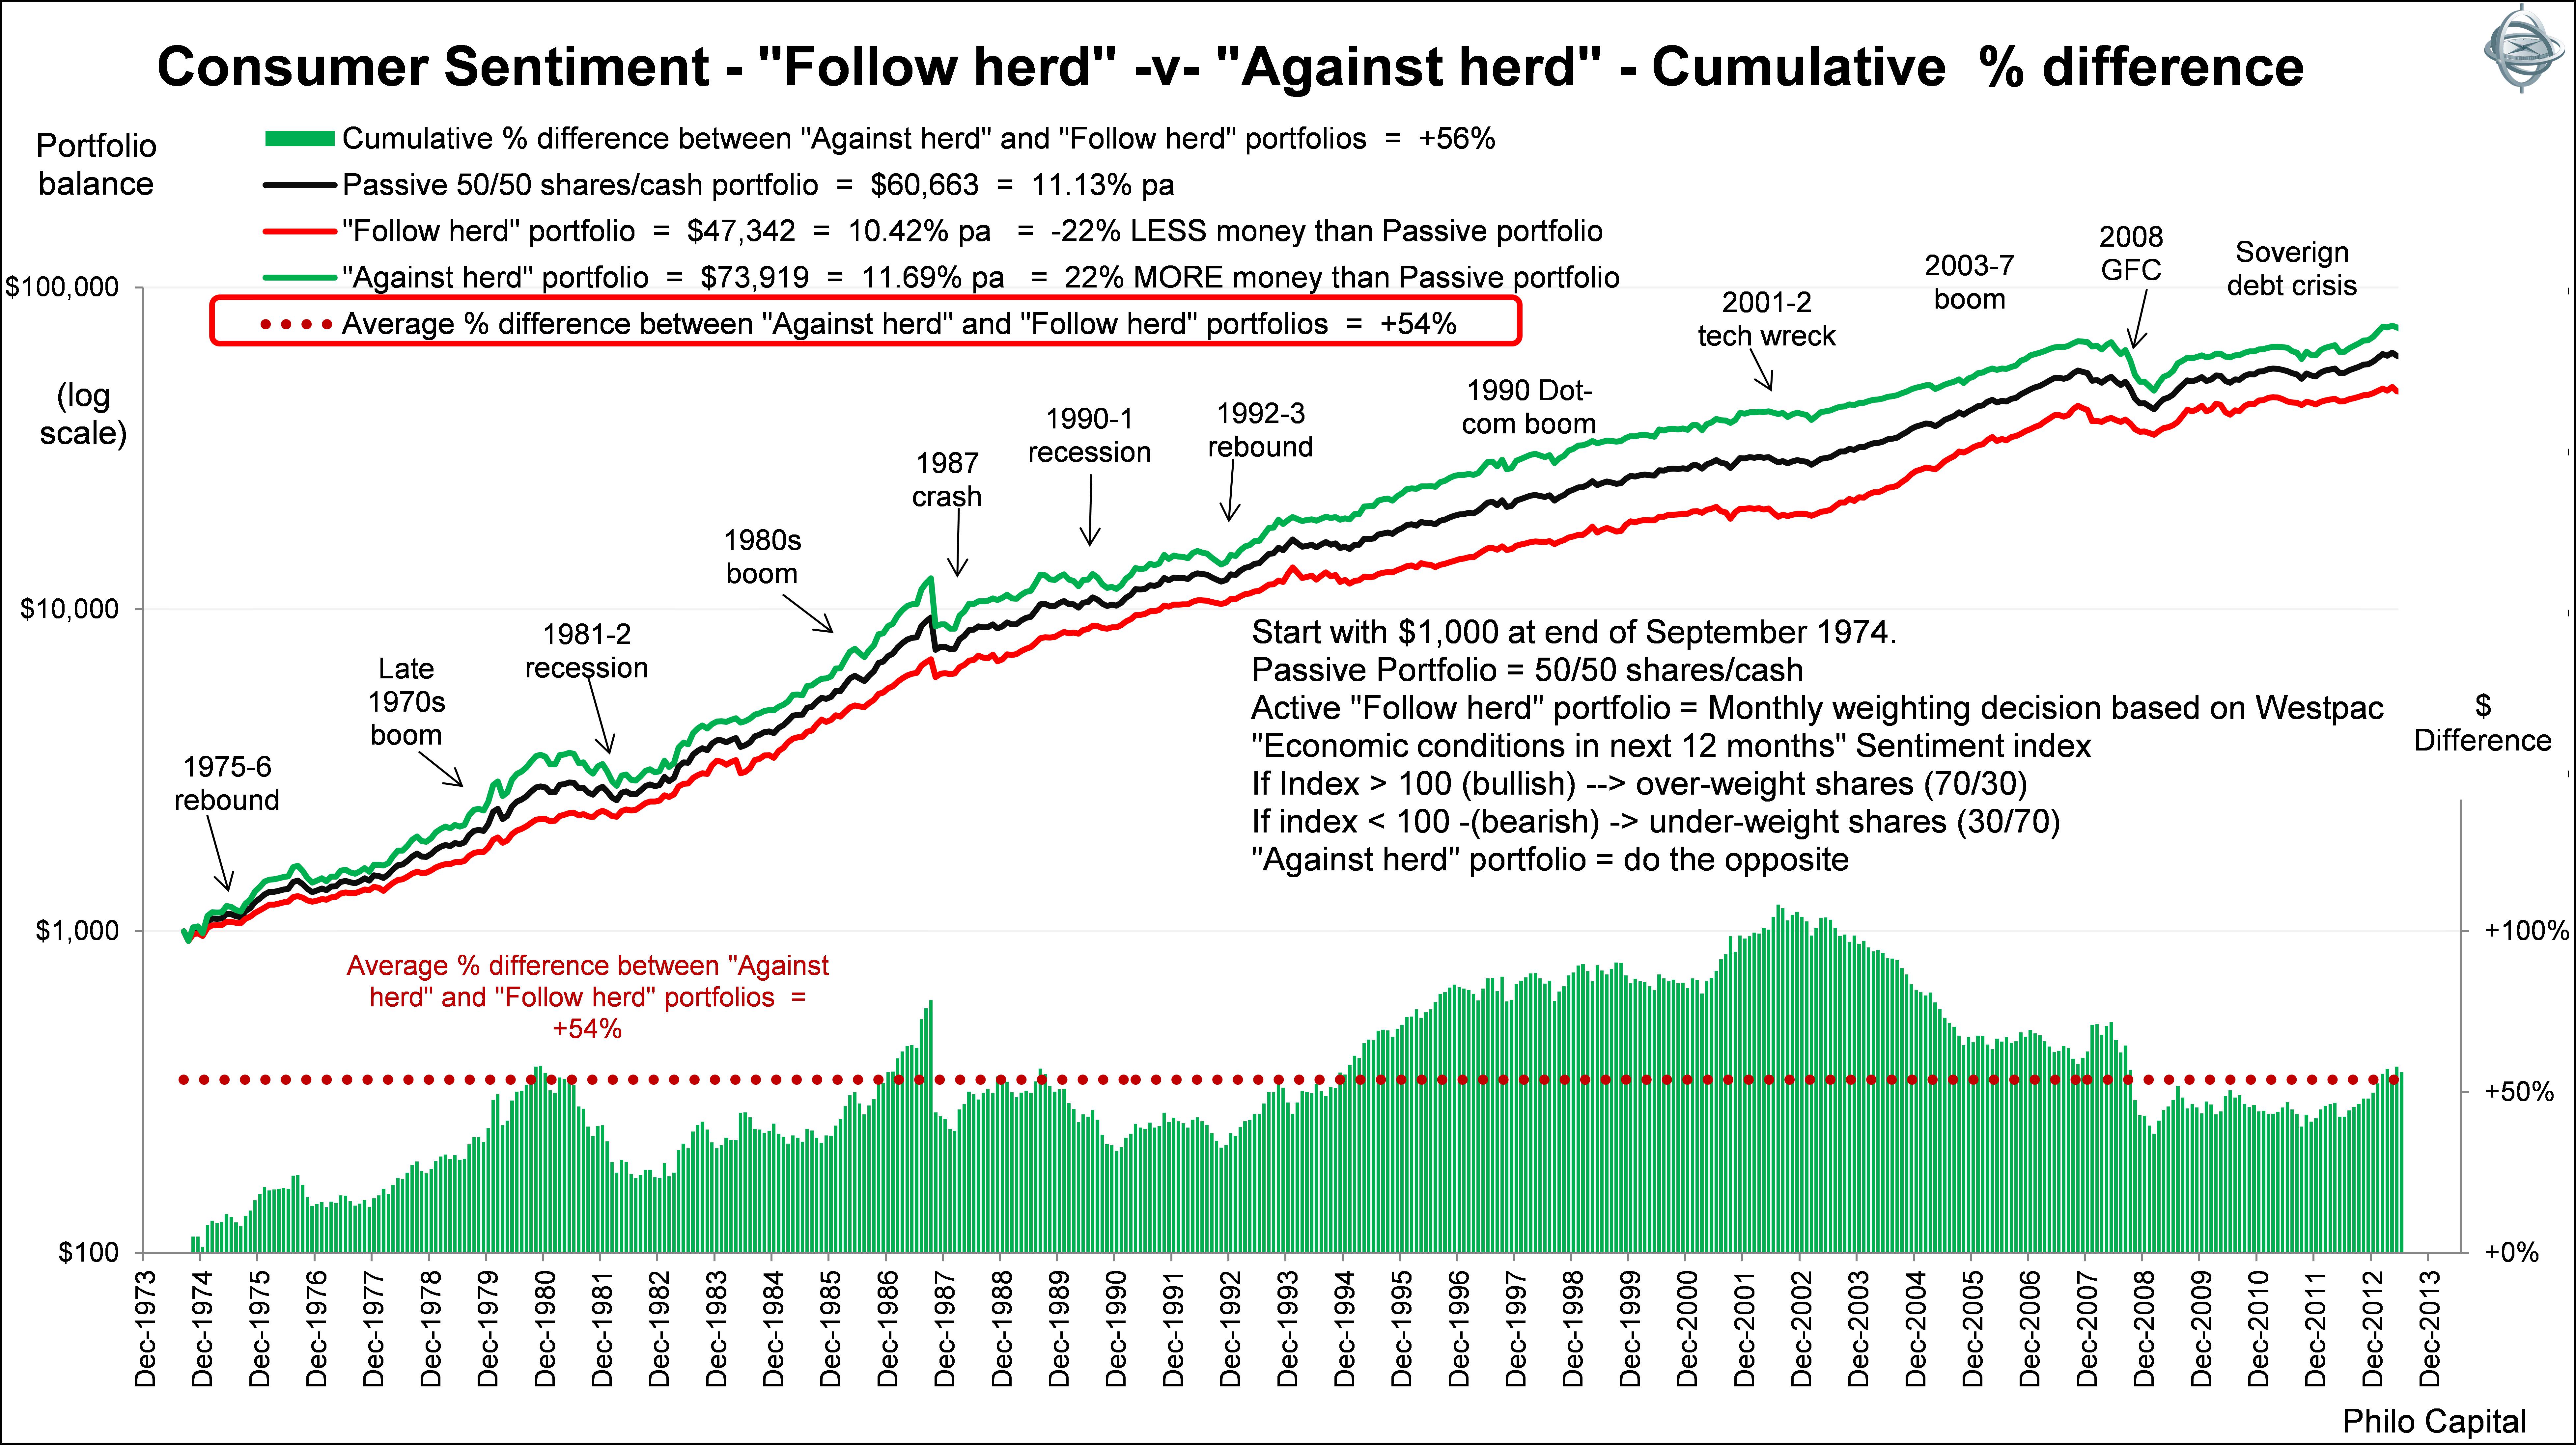
The following chart shows the results. Three portfolios were started with $1,000 and re-balanced each month using the above rules using the Consumer Sentiment Survey results for the prior month.

What are the findings?

The passive benchmark (50/50) portfolio (black line) is re-balanced back to 50/50 shares/cash each month, and would have grown from $1,000 in September 1974 to $60,663 by June 2013, which is 11.1% pa compound total return over the period. (All returns are before taxes and transaction costs but before franking credits. The impacts of these factors would be similar in all portfolios since all three portfolios would need to be rebalanced each month due to market movements alone).

The active ‘follow the herd’ portfolio (red line) is overweight shares in months in which consumers were bullish in the prior month and underweight shares in months in which consumers were bearish in the prior month. The ‘follow the herd’ portfolio would have grown from $1,000 at the start to $47,342 over the same period (10.4% per year). So, by following the herd by buying more shares when the market sentiment is bullish and reducing the weight of shares when sentiment is bearish, the end balance is 22% lower than with the passive 50/50 portfolio.

The active ‘against the herd’ portfolio (green line) is underweight shares when consumers were bullish and overweight shares when consumers were bearish. It would have grown from $1,000 to $73,919 over the same period (11.7% per year). This total return of 11.7% per year over the whole period is 0.56% per year higher than the passive benchmark static portfolio, and 1.27% per year higher than the ‘follow the herd’ portfolio. By going against the herd, the end balance of the ‘against the herd’ portfolio is 22% higher than with the passive 50/50 portfolio.

The bottom section of the above chart shows the extent to which the ‘against the herd’ portfolio would have been higher than the ‘follow the herd’ portfolio over time. At all times the ‘against the herd’ portfolio is ahead of the ‘follow the herd’ portfolio.

On average over the whole period, the 'against the herd' portfolio is some 54% higher than the 'follow the herd’ portfolio and is still around 50% higher after nearly 40 years. 50% higher balances from going against the herd compared to following the herd is a big difference. It means 50% more wealth, 50% more income, and 50% better lifestyle - from just going against the herd and moderately tilting the balanced portfolio against the weight of public opinion at each stage over the 40 year period.

Some conclusions from these findings

Following the herd is a basic human instinct but it destroys wealth. Going against the heard and doing the opposite of what the herd is doing can generate excess returns over and above doing nothing. But it is very difficult to go against the tide and ignore all the hype - especially at the tops of booms and in the depths of the busts.

However, doing the opposite of what the herd is doing - ie selling in booms and buying in busts - is not actually necessary to be a successful investor. If all you do is ignore the herd and avoid buying in booms and avoid selling in busts, then you are avoiding the two most dangerous wealth destruction zones, and you are still going to be better off than probably 90% of investors and fund managers in the market.

Successful investing is mostly about avoiding risks and not blowing up your money. Whether you are rich or poor in 20 or 30 years’ time when you are going to really need the money, is mostly a function of whether or not you make ‘buy-high, sell-low’ mistakes in the critical wealth destruction zones along the way.

Although the relationship between these sentiment measures and subsequent returns from shares has been statistically significant and, when used as a contrary indicator in portfolio decisions, would have led to superior portfolio outcomes (as illustrated above), I am certainly not suggesting that people should follow this plan. It is included here merely to demonstrate that following the herd would have led to a significant destruction of wealth over the past 40 years, relative to doing nothing, and especially relative to going against the herd and doing the opposite.

In the proprietary portfolio models used in our investment process, we do not use the Consumer Sentiment Surveys because the historical data series is not long enough (we require a minimum of 50 years history), and our measures are more robust.

However  they are interesting to look at as additional evidence of the general market sentiment and what the herd is thinking and doing. In other words, we use it as evidence of warning signs and not confirmations. For example, if we are bullish on shares when the general market is also bullish, that is more of a warning sign for us than a comfort.

Surveys like these are regular reminders of the need to ignore the market hype and general sentiment and focus instead on the facts.


Ashley Owen is Chief Investment Officer at advisory firm Stanford Brown and The Lunar Group. He is also a Director of Third Link Investment Managers, a fund that supports Australian charities. This article is general information that does not consider the circumstances of any individual.


15 Comments
Michael Harrington
September 06, 2013

From a behavioral perspective, I think it's easier to explain these investment strategies in terms of risk, rather than reward. People consciously focus on reward, but subconsciously act on risk.

Diversification is a risk reduction strategy and liquidity is a risk factor. The key to risk is management and control - if one can manage and control the risk through some competitive advantage (like Warren Buffett's due diligence), then the rewards for taking on more risk though financial leverage makes sense on a risk-adjusted basis. Buffett is confident he knows his companies well, and always pays less than perceived value. Thus, he feels confident in leveraging up with debt.

But Buffett IS diversified through Berkshire Hathaway. He uses portfolio theory quite effectively by having a portfolio of companies across industries. It should be obvious from his investments that he sees the fundamental value in cash flow to reinvest with a portfolio diversification strategy. These are the reasons he has stayed away from industries such as tech and banking for the most part, in favor of manufacturing, retail, and insurance.

Risk and loss aversion are the keys to behavior, and that applies to any activity; financial investment most of all. As an author you probably know the problem with investment books is that there are too many on the market: excess supply + insufficient demand = low price, fewer sales, less revenue. And it's a winner-take-all market, so the distribution of success is a power law: a few big winners and lots of losers. C'est la vie.

Jan Cermak
August 24, 2013

I do not think that taking money off the table when stock went up is the most important thing. True, risk and stock price are correlated. But as I understand that, for Buffett there is no gaming table. Just well managed financially healthy and understandable companies at reasonable prices (these you buy) and the rest (these you avoid). If there are no companies to buy, you hoard money. And, every time an "eisenreserve" is being kept, for 2008 - like events.

ashley
August 19, 2013

hi warren,
On the timing - the survey released in say mid June is used for the re-weighting decision at end of June, so there is effectively a 1-month lag.
(re Harry's prior comment, the turnover rate is rather high for a "passive" strategy because of monthly re-balancing. I generally use quarterly re-balancing in actuual portfolios, which results in much lower turn-over (around half). Relative outcomes are vitrually the same as with monthly rebals. But I used monthly here because that particular survey is monthly and I was trying to capture the effects of "current" sentiment - ie the latest month)

On the data sources I use All Ords accumulation index since end 1979, then the Sydney All Ords since 1958, then the Sydney 34 Ords since 1936, then the Sydney Commercial & Industrial Index since 1875. Dividend series uses the adjusted Lamberton series since 1882. (The lack of low cost ETFs in early years of course raises the issue of investability for an investor, but in Australia the big 20 or stocks have always dominated market returns, and so the return relativities betwen the strategies would be very similar if virtually any basket of big cap stocks were used)

For cash, I use the greater of 3 month t-bills or bank bill yields since 1959 (since the yield on bills is the total return), and then the greater of bank bills and bank short term bank term deposits since 1851.
good luck with it!

Warren Bird
August 18, 2013

I have a few simple questions, to assist with understanding how this analysis might be replicated.

First, the consumer sentiment index is based on a survey that is usually conducted in the first week of a month. The data are then released around the 9th of the month. For example, the June 2013 index was released on 9 June, based on sampling undertaken at the beginning of that month.

Has the analysis then aligned this with end-June ASX levels, or with end-May?

Second, what ASX index has been used? I presume that it's the All Ordinaries Accumulation Index because the ASX200 doesn't go back to 1974.

Third, how has the return on cash been calculated? The standard index these days is the UBS Bank Bill index, but it doesn't go back to the 1970's either.

Fourth, how was the dividend reinvestment calculated prior to 1979. The All Ordinaries index was developed in that year, but the analysis has 5 years of history before then.

ashley
August 15, 2013

hi harry,
to keep it simple I did that example before transaction costs and taxes, but the relative results of the three strategies are not materially different if transaction costs and taxes (including franking credits) are included. It is the relative returns from the three strategies that are important. The relativities remain the same and the differences in tax/cost drag are minor compared to the differences in returns.

For example a "passive" portfolio does not mean zero turnover because it is still rebalanced back to the neutral weight. Passive turnover in this type of portfolio would be around 30% pa, which would generate transaction cost drag of around 3 bp pa (based on 10bp per trade each side) and tax drag of around 140bp pa (at 15% tax rate and including franking after June 1987). Turnover in both Active portfolios is around 80% which is much higher. Transaction cost drag is around 8bp pa and tax drag is around 160bp pa after franking credits.
So the differences in tax/cost drag between active and passive is around 20 basis points pa, compared to the 100+ basis point difference in returns. Importantly, the differences between the two active portfolios ("With" and "Against" the heard) are even smaller because they are taking opposite sides of the same trades.

But this is just detail. The main point is that the differences in returns are large and make a big difference to the investor's wealth and standard of living. Again, I'm not advocating doing this (the models we use are much more powerful than this), but it shows the differences if investors did follow or against the confidence index.
cheers

ashley

Chris Eastaway
August 18, 2013

Hello Ashley, thanks for the thought provoking articles, but I’m hopeful you can clear something up for me.

I understand that in your example the passive portfolio is not passive in the truest sense of the word – as you point out the portfolio has about a 30% annual turnover at a cost of roughly 143bp. My question (which I could answer myself if I had your model) is, how does the passive (but active) portfolio stack up against a simple buy and hold strategy for the same period - assuming $1000 capital was allocated to 50% cash and 50% shares in September 1974?

Perhaps this is too simple. However, if we suppose for the sake of the example that our shares were bought in companies within the ASX top 20 - all offering dividend re-investment programs to remove the burden of brokerage (I’m only 30, you can correct me if that’s a new thing) - then it seems reasonable to assume the 143bp difference between your “actively passive” portfolio and your “active” portfolios should be added to the gains of a “truly” passive portfolio to give an annualised return of 12.53% (your 11.1% +143bp for fees - I understand I could have deducted 1.43% from your 11.1%, but the point remains the same).

In this scenario $1000 compounded over 39 years becomes $96,808 – which is a 30%+ greater return than your benchmark portfolio. If this is right then surely churn is creating drag that is quite material.

Moreover I should mention that we’ve spoken before and while “devotee” would be too strong a word, it’s true that I’ve followed the advice laid out in your books and articles to a degree that has required tremendous devotion and self discipline. So far I’ve done very, very well following the plans laid out by your good self (thank you), but given one of the key messages I’ve taken away from your previous writing is that growth assets should never be sold (if bought well in the first place – I use ETF’s), you can see why perhaps I’m confused you didn’t include a passive portfolio in the truest sense of the term for comparison.

Perhaps my math is wrong, and like you said these are just details, but I would be interested in your thoughts.

Harry Chemay
August 14, 2013

Ashley, I'm struggling to draw the same conclusions you have from the results of your back-test. It's probably me, but perhaps you could help clarify a few issues.

First, you mentioned that "all returns are before taxes and transaction costs but before franking credits". Did you mean to say "after taxes and transaction costs…"? If the 'active' portfolios were re-balancing to either 30% or 70% Australian equities (potentially each month) then brokerage costs would have been very material, as would have taxes after the introduction of capital gains tax in 1985.

You indicated that the impact of taxes and transaction costs would be "similar in all portfolios since all three would need to be rebalanced each month due to market movements alone". Yes and no. Yes, all three would be rebalanced each month. But rebalancing the 50/50 'passive' portfolio would only require minor monthly adjustments, compared to a potential +/- 40% change in the other two portfolios. Turnover and hence costs (both execution and taxes) would be significantly higher in the two dynamic portfolios compared with the passive portfolio. Hence my desire to understand whether the end results were net of costs and tax.

Next, the data in the accompanying chart shows that contrarian investing (against herd) would have produced a superior end wealth result compared to the 'with herd' portfolio over the roughly 39 year period between September 1974 and June 2013. But over shorter periods this advantage appears to be less conclusive, and actually reverses in times of extreme stress. Take for example the 1987 crash. The cumulative % difference bar chart suggests that between October 1987 and March 1988 the against herd portfolio fell much more than the with herd portfolio (something in the order of 25% to 40% more).

Likewise during the GFC the against herd portfolio fell significantly more than the with herd portfolio (around 30% to 40% more between June 2007 and March 2008). The 'peak to trough' drawdown levels for the against herd portfolio don't look all that encouraging at first glance. If anything the with herd portfolio seemed to have fared better in large market corrections than both the passive portfolio and the against herd portfolio over the back-test period.

ashley owen
August 12, 2013

Hi Thomas,
Buy and hold only works if you have a long, long, long investment horizon. A buy and hold investor who bought Dow index stocks at the market peak in 1929 had to wait until 1954 to get back to square - or 1959 after inflation! That's a long time to wait.

Buffett addressed this flaw by saying his "time horizon is fovever", which is fine since he never needs the money. He has never paid a dividend and he is giving it away to charity anyway.
On the other hand most investors need to be able to access their assets to live off. Retirees need to access their investments immediately and continuously for their living expenses, so for them timing is critical.

Using passive funds like index funds and passive asset allocation can take decades to get ahead if you buy at the wrong time. Every asset class, and every combination of asset classes, goes backwards for decades at a time after inflation (including and especially cash and so-called "risk-free" government bonds) so timing is critical. Unless of course your time horizon is forever and you are giving your money away anyway. cheers ashley

Thomas Eyssell
August 11, 2013

Which Warren Buffett advice should one follow? He has also said the average investor is better off investing in low cost index funds for the long-term; in other words, buy-and-hold.

Paul Thind
August 11, 2013

This also confirms the other observations, which is that the average person, average active asset manager, the decision making processes based on voting systems will lead to sub-optimal outcomes in pretty much all aspects of life. There are good reasons for this and lack of opportunities in education, lack of access to information and reasoned debate, lack of understanding of numbers and risks are probably the key determinants.
In this sense it makes sense for the average person to be just invested in the markets.

We have some indicators that are similar that move from equities into bonds and prove that market sentiment indicators with more information in them generate much better signals compared with the market.

Paul Thind

ashley owen
August 10, 2013

Yes Herman I agree entirely - fear and greed are useful emotions for cavemen/women but not for investors, so we try to remove emotion from the investment decisions as much as possible. Instead focus on what really matters - your goals, needs, time horizon, etc then quietly go about finding good companies/assets at good prices.
Using that approach, we find that good assets are cheapest when most people are selling frantically, and conversely even great assets should be sold when crazy once-in-a-lifetime prices are offered.

ashley

Herman Brodie
August 09, 2013

Warren Buffetts’s famous edict about ‘being greedy when others are fearful and fearful when others are greedy’ has always struck me as rather poor advice. Although it is intuitively appealing, it doesn’t help if I happen to be one of the ‘others’. By definition, most investors have to be among the ‘others’ for Buffett to succeed. Perhaps a more useful counsel would be to be greedy when Warren is greedy and fearful when he is fearful or, quite simply, to be less greedy and less fearful, period.

Christine Cargnoni
August 09, 2013

"Successful investing is mostly about avoiding risks and not blowing up your money" -the most interesting statement of the article. Risk management is the key. Let's not get greedy people, when a stock price has increased significantly, and you have made money, take a little off the table and build cash for future opportunities. This is just common sense to me, but overall good statistical information.

ashley owen
August 09, 2013

hi grant,
yes, I have always found it very hard to convince people not to follow the herd - both at the top and at the bottom. But the main aim is to prevent them gearing up and betting the house buying assets at crazy prices in booms. Since the 1980s I have observed the people who can least afford to lose money are generally those who delay cautiously while the market rises for several years, but they finally decide to take the plunge very late in the boom and right before the bust, because they can see that everybody else is doing it. It is very sad and frustrating and completely avoidable.
cheers

ashley

Grant Patterson
August 09, 2013

I thought the p.a. difference would have been greater.

I am a big believer in the role human behaviour has in relative investment returns, normally to the detriment of performance.

I am surprised therefore that the differential between following the herd and against the herd portfolios was not greater particularly if active management fees were to be included.

Of course these benchmarks are measured against the index which is by its nature the collection of the herds investment views.

I firmly believe that professional active management , index unaware combined with against the herd investing leads to superior after tax returns over the medium to ling term.

Just ask Warren!


Leave a Comment:

banner

Most viewed in recent weeks

Five months on from cancer diagnosis

Life has radically shifted with my brain cancer, and I don’t know if it will ever be the same again. After decades of writing and a dozen years with Firstlinks, I still want to contribute, but exactly how and when I do that is unclear.

Uncomfortable truths: The real cost of living in retirement

How useful are the retirement savings and spending targets put out by various groups such as ASFA? Not very, and it's reducing the ability of ordinary retirees to fully understand their retirement income options.

Is Australia ready for its population growth over the next decade?

Australia will have 3.7 million more people in a decade's time, though the growth won't be evenly distributed. Over 85s will see the fastest growth, while the number of younger people will barely rise. 

The public servants demanding $3m super tax exemption

The $3 million super tax will capture retired, and soon to retire, public servants and politicians who are members of defined benefit superannuation schemes. Lobbying efforts for exemptions to the tax are intensifying.

20 US stocks to buy and hold forever

Recently, I compiled a list of ASX stocks that you could buy and hold forever. Here’s a follow-up list of US stocks that you could own indefinitely, including well-known names like Microsoft, as well as lesser-known gems.

The challenges of retirement aren’t just financial

Debates about retirement tend to focus on the financial aspects: income, tax, estates, wills, and the like. Less attention is paid to the psychological challenges of retirement, which can often be more demanding.

Latest Updates

Shares

Are term deposits attractive right now?

If you’re like me, you may have put money into term deposits over the past year and it’s time to decide whether to roll them over or look elsewhere. Here are the pros and cons of cash versus other assets right now.

Retirement

How retiree spending plummets as we age

There's been little debate on how spending changes as people progress through retirement. Yet, it's a critical issue as it can have a significant impact on the level of savings required at the point of retirement.

Estate planning made simple, Part I

Every year, milions of dollars are spent on legal fees, and thousands of hours are wasted on family disputes - all because of poor estate planning. Here's a guide to a key part of estate planning - making an effective will.

Investment strategies

Markets are about to get a whole lot harder

As the world shifts away from one of artificially suppressed interest rates and cheap manufacturing, investors will need to carefully consider how companies are positioned to navigate the new higher-cost paradigm.

Investment strategies

Why commodities deserve a place in portfolios

2024 looks set to be another year of reflation and geopolitical uncertainty — with the latter significantly raising the tail risk of a return to problematic inflation. That’s a supportive backdrop for commodities.

Property

What’s next for Australian commercial real estate?

It's no secret that Australian commercial property has endured its most challenging period since the GFC. Yet, there are encouraging signs that the worst may be over and industry returns should improve in the medium term.

Shares

Board games: two hidden risks for stock pickers?

Allan Gray's Simon Mawhinney thinks two groups with huge influence over our public companies often fall short of helping shareholders. In this interview, Mawhinney also talks boards, takeovers, and active investing.

Sponsors

Alliances

© 2024 Morningstar, Inc. All rights reserved.

Disclaimer
The data, research and opinions provided here are for information purposes; are not an offer to buy or sell a security; and are not warranted to be correct, complete or accurate. Morningstar, its affiliates, and third-party content providers are not responsible for any investment decisions, damages or losses resulting from, or related to, the data and analyses or their use. To the extent any content is general advice, it has been prepared for clients of Morningstar Australasia Pty Ltd (ABN: 95 090 665 544, AFSL: 240892), without reference to your financial objectives, situation or needs. For more information refer to our Financial Services Guide. You should consider the advice in light of these matters and if applicable, the relevant Product Disclosure Statement before making any decision to invest. Past performance does not necessarily indicate a financial product’s future performance. To obtain advice tailored to your situation, contact a professional financial adviser. Articles are current as at date of publication.
This website contains information and opinions provided by third parties. Inclusion of this information does not necessarily represent Morningstar’s positions, strategies or opinions and should not be considered an endorsement by Morningstar.