The listed property trust (LPT) sector in Australia has beaten shares in four of the past five years and they are doing so again in 2016. This article explains the reasons and why my portfolios have been overweight LPTs since the start of 2012.
The first chart shows total returns from Australian shares versus LPTs from 2011 until the end of March 2016.
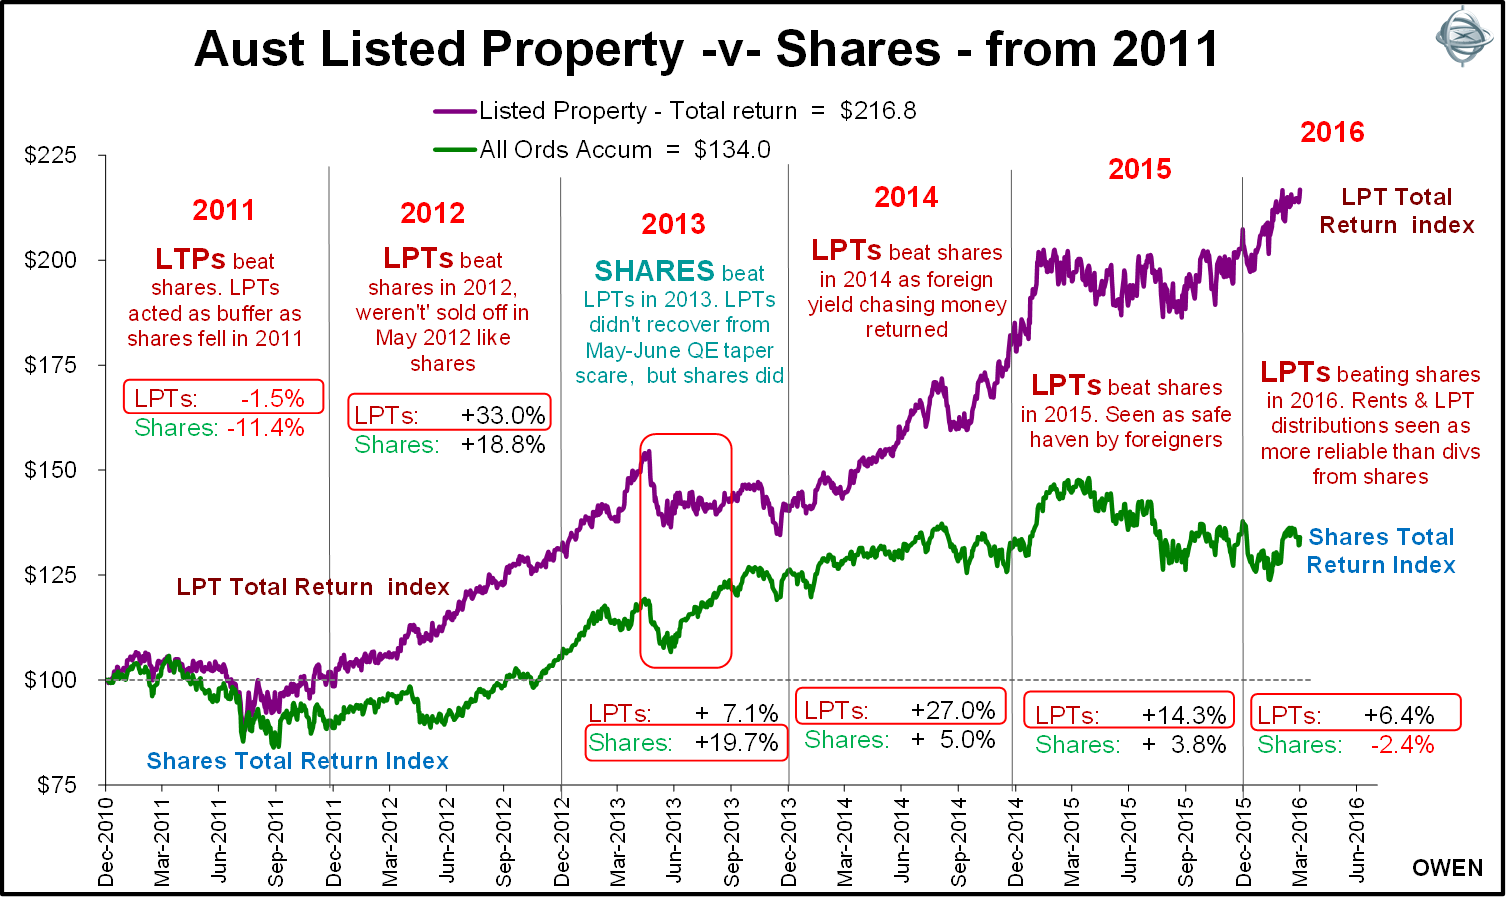
Similar total returns to shares – but different mix
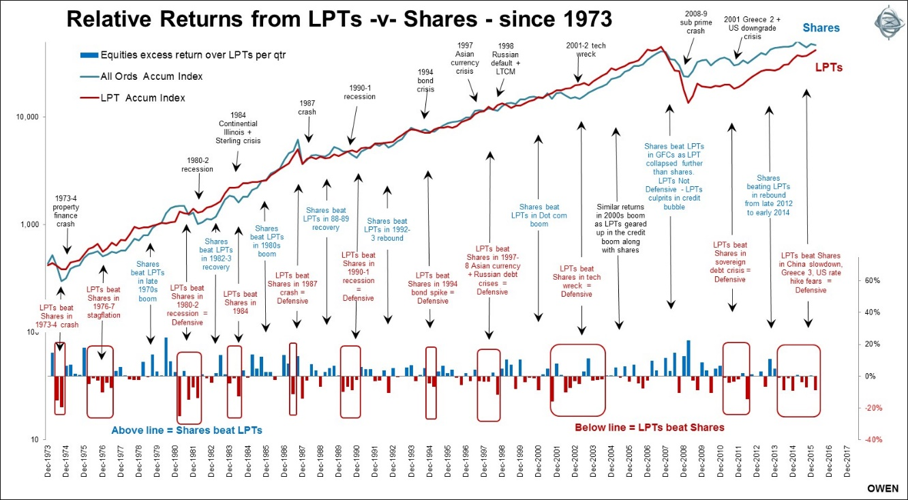
The LPT sector and the overall stock market have each generated total returns (capital growth plus dividends and distributions) averaging around 13% to 14% per year over the past four decades, but the mix of income/growth has been very different. Two-thirds of total returns from shares have come from capital growth (price gains) and only one third from income (dividends). For LPTs, 70% of total returns have come from income (trust distributions) and only 30% from capital growth.
Because LPTs have generated higher income and less capital growth, they have been seen somewhat as ‘safe havens’ relative to shares, with property rents considered more stable and reliable than share dividends. As such, LPTs have provided a partial buffer against shares and suffered less in market sell-offs, including the 1973-74 crash, the 1976-77 stagflation, the 1980-82 recession, the 1987 crash, the 1994 bond crisis, the 1990-91 recession, the 1997-98 Asian currency and Russian debt/LTCM crises, and the 2001-02 ‘tech wreck’. On the other hand, LPTs have underperformed shares in the stock market rebounds and booms between the sell-offs.
This is shown in the following chart of accumulated total returns from LPTs and shares.
2008-2009 global financial crisis
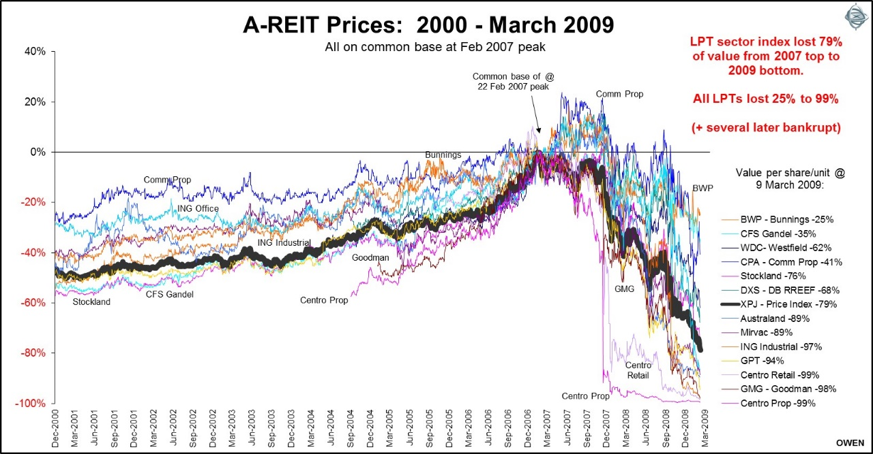
But the ‘safe haven’ status of LPTs was shattered in the 2008-09 GFC crash because LPTs were a big part of the problem rather than a defensive safe haven. LPTs enjoyed an almighty bubble in the mid-2000s boom, driven largely by debt, ill-timed and ill-advised expansion, over-priced acquisitions and financial trickery.
Consequently, LPTs crashed even more than shares in the global credit crisis, falling 79% from the February 2007 top to the March 2009 bottom. The All Ordinaries index fell ‘only’ 52% from top to bottom. The best of the LPTs was BWP (Bunnings), but several were down more than 90%, including aggressive up-starts like Centro and Goodman, but also formerly conservative, decades-old trusts like GPT.
The following chart shows the extent of the price collapses of the main trusts and the overall LPT index in the 2008-09 GFC crash.
To make matters worse, many thousands of investors used margin loans to gear up into LPTs, cooking up a ‘Sara-Lee’ layer cake of gearing. Untold thousands of investors lost their life savings and their homes when prices crashed and lenders sold out at the bottom and repossessed assets to secure their loans.
LPTs underperformed shares in 2007, 2008, 2009 and 2010. The catastrophic losses, bankruptcies and financial shenanigans in some LPTs turned many local investors off them for life. The final straw was the disgraceful treatment of unitholders in several trusts that diluted loyal investors by not allowing access to deeply discounted emergency capital raisings in the depths of the crisis.
LPTs reborn
In the aftermath of the crash the surviving LPTs re-structured and cleaned up their act. They dumped their CEOs, shed foreign acquisitions, raised equity, cut debt levels, rebuilt capital, shifted from short-term debt to more stable long-term debt, returned to low-risk rent collecting and limited development in their core markets.
When we underweighted shares in portfolios in mid-2011 prior to the stock market sell-off in the US downgrade crisis, we favoured LPTs (and bonds). We continued to favour LPTs when we over-weighted shares again from early 2012 at the start of the ‘QE’ boom.
Since then LPTs have out-performed shares in 2011, 2012, 2014 and 2015. (In 2013 LPTs still returned a modest +7% but shares did even better at +20%).
Listed beat unlisted property
LPTs also outperformed unlisted property over the 2011 to 2016 period because LPTs were trading at discounts to the net value of their underlying properties at the start of the period. The discounts disappeared as prices rose, and the sector is now trading at a premium, as shown below.
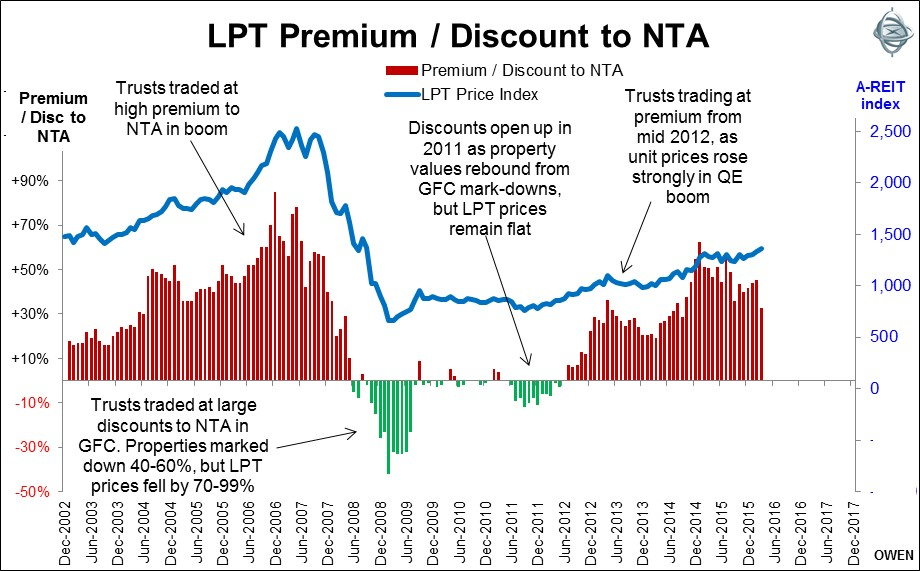
This shift from discounts to premiums boosted returns for LPTs relative to the underlying commercial property market. The listed sector has returned more than 15% per year on average over the past five years, well ahead of unlisted trusts and direct properties at 10-11% per year.
Current outlook
We believe the LPT sector is now fully priced. Distribution yields are at record lows, most trusts are trading at significant premiums to the value of their underlying properties and properties are valued on record low yields (capitalisation rates). Gearing levels are creeping up again, although this time with more stable and long term debt structures than in the mid-2000s credit bubble.
However, I believe that the foreign investors who have mainly driven up prices will continue to support LPTs. While LPT yields are at historic low levels they are still significantly higher than local and global rates on cash, bonds and bank term deposits. Further, rents from ‘bricks and mortar’ which underpin distributions from LPTs are seen as more reliable than dividends from shares. The two big sectors of the local stock market – banks and miners – are coming under increasing pressure to cut dividends, whereas rents from commercial properties are holding up while the labour market remains relatively strong and the unemployment rate is not rising.
Ashley Owen (CFA, BA, LLB, LLM, Grad. Dip. App. Fin) has been an active investor since the mid-1980s, a senior executive of major global banking and finance groups, and currently advises wholesale investors and advisory groups. This article is general information and historical facts for educational purposes only. It is not intended as advice and it does not consider the personal circumstances of any individual.