Register For Our Mailing List

Register to receive our free weekly newsletter including editorials.

Home / 352

One trillion and counting: is government debt a problem?

Some stories bear repeating. Back in 2013, Chris Cuffe wrote an article in Firstlinks (then Cuffelinks) entitled Until debt do us part, Act 1.

Its basic premise was that concerns and commentary about government, national and household debt were often off the mark. It pointed out, from an accountant’s perspective, that 'debt to GDP' ratios were a mix of stock and flow numbers. The level of debt is a stock item while GDP or national income is a flow item.

Can we service our rapidly-rising debt?

This mix of accounting concepts distracts us from the primary issue that debt creates, namely capacity to service. The article suggests that debt servicing ratios are more helpful in determining our level of concern and should be the focus of commentary.

With Australia’s household debt at record levels (see chart below), our general government debt about to reach levels not seen since WWII (due to the Covid-19 response) and foreign debt now in excess of $1 trillion, it’s time to remember Chris Cuffe’s basic accounting principle. Undoubtedly, we will soon start reading horror stories about debt. Be prepared.

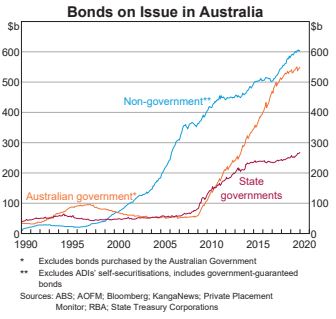
As shown below, government bonds on issue have already risen rapidly since 2010, and will exceed $1 trillion within six months after funding the stimuls packages.

The current economic policy response to Covid-19 continues to unfold. Its economic aim is to cushion the economy from the impact of its policies to control the health crisis (lockdowns).

The scale of the economic response is lifting debt to the point where previously agreed up debt ceilings are being lifted. While in the United States, this has caused political grandstanding and generated market uncertainty, in Australia it has passed by with little comment.

Economy is still functioning

On whatever measures you chose to use (and, debt to GDP, sadly, is the most common) Australia’s government debt is low by world standards. It is set to rise, but even if it were to double, it would still sit below the debt to GDP ratios of nations with comparable standards of living.

What about our ability to service this new debt? This depends primarily on two things, our income and the interest costs.

Without doubt our income will take a hit this year. It may well be subdued for a few years to come. No one really knows the endgame of Covid-19 but a vaccine does seem probable, but with considerable delay. That said, the economy has not stopped in its tracks. Income will be down but not out.

An unemployment rate of 10 or 15% is an economic and social disaster but it also says that 85-90% of the economy is still operational. There will be wages earned, profits made, and taxes paid. There will still be a flow of income to the government from which debt payments can be made.

And what about the cost? Today interest rates are at historical lows. Low borrowing costs can be locked in for a decade. Rates will rise but not soon. In the meantime, we have the capacity to rebuild our economy, reduce unemployment, rethink our ways of doing business and adjust our priorities.

I don’t wish to underplay the risks associated with taking on debt. It’s never a riskless exercise, but likewise, I want us to understand the metrics that matter.

What are the metrics that matter?

GDP or national income in 2019 was almost $2,000 billion. Government debt outstanding was almost $600 billion in the latest Reserve Bank chart shown above (released on 4 March 2020). According to the budget papers, government debt in 2018-19 was estimated at $373 billion with interest costs of $14.1 billion while government revenue was $485 billion.

At the time of writing the government had announced some $350 billion in new spending. The largest items are the JobKeeper, business support and JobSeeker programmes. The exact timing and magnitude is not known and further programmes may be required.

Taking the estimate of $350 billion as a base number for new debt due to spending programs, this adds $0.9 billion per year in interest costs. However, if government revenue falls by say 20% or $100 billion new debt could rise to $450 billion and total new interest costs of $1.1 billion.

The government is already paying $14.1 billion per year in interest costs. Total annual interest costs would rise to around $15.2 billion under this new scenario. Is this manageable? Yes. A resulting debt service ratio of 3.9% is well above that of recent years but is on par with levels seen during the 1980s and 1990s.

In a nutshell, the increase in debt resulting from new government spending programmes and a decline in government revenue is manageable. While we would prefer not to be in this position, from a debt financing position it is not a crisis.

We have been here before and we will come out the other side.


Hans Kunnen is the Principal at Compass Economics and was formerly an economist with Colonial First State and St George Bank.


5 Comments
Josh
April 11, 2020

Hans I wonder what you think about US debt and Chinese debt? The massive rise in global debt that is now underway?
Ultimately this ends in the loss of faith in paper currencies that are backed by NOTHING.
No one wants to talk about the ultimate outworking of what has just started but this ends badly as printing money doesn't work even though all the Keynesians out there think it's the only solution.

AlanB
April 10, 2020

I agree with you, debt is manageable. But what we will now see are people opportunistically using COVID-19 debt to push their own long-held pet redistributive agendas, like:
- higher income tax rates;
- higher petrol taxes;
- higher GST;
- abolition of franking credits;
- abolition of negative gearing;
- re-introduction of an inheritance tax;
- elimination of stamp duties;
- mining taxation, etc etc.
Will the Government be able to resist?

Jacklett
April 09, 2020

From whom did our Govt. borrow around $600bn ?
PeterB

SMSF Trustee
April 09, 2020

all sorts of people invest in Government bonds, from super funds to insurance companies to foreign central banks and sovereign wealth funds, to our own banks. And of course the Reserve Bank of Australia.

it's not a big deal. there's huge demand for very low risk assets like that. Not in most SMSF's to be true, but the world doesn't actually revolve around small investors like you and me.

Dave
April 08, 2020

Since 1932 the United States has only balanced its budget or had a surplus for 11years. Why we worry about our deficits is caused by politics and not based on real world economics.


Leave a Comment:

RELATED ARTICLES

Lessons from 100 years of growing US debt

banner

Most viewed in recent weeks

Raising the GST to 15%

Treasurer Jim Chalmers aims to tackle tax reform but faces challenges. Previous reviews struggled due to political sensitivities, highlighting the need for comprehensive and politically feasible change.

7 examples of how the new super tax will be calculated

You've no doubt heard about Division 296. These case studies show what people at various levels above the $3 million threshold might need to pay the ATO, with examples ranging from under $500 to more than $35,000.

Are franking credits hurting Australia’s economy?

Business investment and per capita GDP have languished over the past decade and the Labor Government is conducting inquiries to find out why. Franking credits should be part of the debate about our stalling economy.

Here's what should replace the $3 million super tax

With Div. 296 looming, is there a smarter way to tax superannuation? This proposes a fairer, income-linked alternative that respects compounding, ensures predictability, and avoids taxing unrealised capital gains. 

The rubbery numbers behind super tax concessions

In selling the super tax, Labor has repeated Treasury claims of there being $50 billion in super tax concessions annually, mostly flowing to high-income earners. This figure is vastly overstated.

9 winning investment strategies

There are many ways to invest in stocks, but some strategies are more effective than others. Here are nine tried and tested investment approaches - choosing one of these can improve your chances of reaching your financial goals.

Latest Updates

Taxation

100 Aussies: seven charts on who earns, pays, and owns

The Labor government is talking up tax reform to lift Australia’s ailing economic growth. Before any changes are made, it’s important to know who pays tax, who owns assets, and how much people have in their super for retirement.

7 key charts on the state of the Australian property market

The Australian property market stirs fierce debate - often bullish optimism versus crash predictions. But beyond the noise, seven charts reveal what's really driving prices and the outlook for residential real estate.

A simple alternative to the $3 million super tax

Division 296 aims to introduce improved fairness into the superannuation system, yet is overly complex. This scours the world for better ideas and suggests a simpler alternative which can achieve the same goals.

CBA and the index conundrum for super funds

After the hyperbolic rise in CBA shares, super funds are floating the idea of carving out the weightings of ASX bank securities and indexing them within their portfolios. This looks at why that might be a big error.

Strategy

10 policies to drive Australian productivity higher

Here's a comprehensive list of proposed reforms to fix Australia's stagnating economy, including introducing a flat income tax rate, reducing migration, and making childcare tax-deductible.

Interviews

Where to find big winners in Asia

As more money looks for a home outside the US, Asia may soon get some love. Fidelity's Anthony Srom outlines the best places in Asia to invest, including in Chinese consumer names, Indian financials, and Thailand.

Investment strategies

We have trouble understanding the time value of money

We overvalue the present and underestimate the future - it’s a cognitive glitch called hyperbolic discounting. It affects savings, spending, and loans, and it's more common - and costly - than we think. 

Sponsors

Alliances

© 2025 Morningstar, Inc. All rights reserved.

Disclaimer
The data, research and opinions provided here are for information purposes; are not an offer to buy or sell a security; and are not warranted to be correct, complete or accurate. Morningstar, its affiliates, and third-party content providers are not responsible for any investment decisions, damages or losses resulting from, or related to, the data and analyses or their use. To the extent any content is general advice, it has been prepared for clients of Morningstar Australasia Pty Ltd (ABN: 95 090 665 544, AFSL: 240892), without reference to your financial objectives, situation or needs. For more information refer to our Financial Services Guide. You should consider the advice in light of these matters and if applicable, the relevant Product Disclosure Statement before making any decision to invest. Past performance does not necessarily indicate a financial product’s future performance. To obtain advice tailored to your situation, contact a professional financial adviser. Articles are current as at date of publication.
This website contains information and opinions provided by third parties. Inclusion of this information does not necessarily represent Morningstar’s positions, strategies or opinions and should not be considered an endorsement by Morningstar.