‘Neither a borrower nor a lender be, for loan oft loses both itself and friend …’
Though written around four centuries ago by William Shakespeare in Hamlet, this is a relevant topic for the times we are in today.
When the media latches onto stories dealing with debt, the tone tends to be alarmist. Such news lifts ratings but it doesn’t always shed light on the issues at hand. Is the nation drowning in debt? How much is ‘too much’ debt?
We must always be mindful of which debts we are dealing with – the debt of the federal government; the nation’s foreign debt; or the debt of Australian households? Headlines will often comment that debt has reached a certain ‘critical’ level of GDP (gross domestic product, which is a measure of the annual income of the nation, the value of the goods and services Australia produces each year) and disaster looms. Debts have never been so high. But this is a rush to judgement.
I’m an accountant by training so I like to make sure numbers are in the right spot, be it the profit and loss statement (a period of time measurement) or the balance sheet (a point of time measurement). I think that is how we need to correctly analyse the national debt instead of mixing the concepts up.
What’s wrong with debt to GDP?
The ratio of debt to GDP is the commonly expressed measurement that people use to analyse whether a country’s debt is too high. But in my view, debt to GDP ratios tend to muddle accounting principles. Debt is a ‘stock’ item and belongs in a balance sheet. It’s a liability. GDP is a ‘flow’ item; it’s what we earn each year. It belongs in the profit and loss statement. To untangle these items we should look at the ratio of debt servicing costs to income, usually called the debt service ratio, and then we can consider the debt to assets ratio. The debt service ratio is easily calculated for most debts. We know what interest payments the federal government must make each year and we know its revenue.
To put things another way, if GDP is the personal equivalent of your annual salary, then should we measure your debts as a proportion of your salary or as a percentage of your assets? More likely we tend to look at your ability to service your debts. What percentage of your salary are your loan repayments?
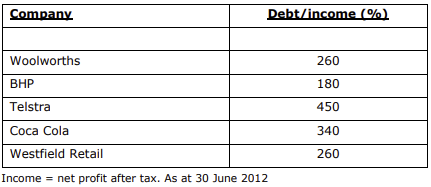
Those who believe gross debt to GDP or income is a measure of quality should be alarmed at the debt to income ratios of some of Australia’s highest-rated companies:
So is our government debt level alarming?
What is the government’s debt service ratio and has it been higher in the past? This financial year the debt service ratio (interest payments to income) of the federal government will be 2%. It has been higher, 6.5% in mid-1990s, and it has been lower. But 2% hardly constitutes a crisis. Again we can argue over alternative uses for the interest payments, which will be $7.2 billion, but interest payments have been as high as $9 billion per year in the not too distant past.
When it is breathlessly announced that the federal government will be in debt to the tune of $300 billion sometime this year, it is conveniently forgotten that many people owe money to the government as well. The government’s net debt will be around $160 billion this year. This is a large number – and we can argue about how we got there – but is it too much in a ‘crisis’ sense?
The government’s debt to assets ratio (if we use the Australian economy as our asset base) is close to 3% assuming that debt is $300 billion and the nation’s assets are conservatively worth around $10.1 trillion or $10,100 billion. When someone says the federal government has saddled each of us with $13,043 of debt ($300 billion divided by our population of 23 million) we can retort with the equally absurd statement that we each have at least $439,000 in assets.
Is our household sector sinking under unbearable debts?
Without doubt some people are deeply in debt and face financial trauma. But there are 8 million households in Australia and not all face crippling debts. Almost 30% of households have no debt at all. Around 60% of household debt is home mortgages, 30% is for investment housing and 10% is ‘other personal borrowing’ such as credit cards and car loans.
According to the Reserve Bank of Australia and the Australian Bureau of Statistics, the indebtedness of Australian households has risen from $190 billion in 1990 to $1,400 billion in 2012. Household debts as a proportion of household assets have risen from 9% to 18% over the same period.
The household debt service ratio tends to move with interest rates and debt levels. In the mid 1980s household interest payments as a percentage of household disposable income was only 5.5%. It rose to 9% in the late 1980s as interest rates rose and then fell back to 6% in the early 1990s. It peaked again at 13.2% in June 2008 before falling back to 9.8% in December 2012. As a sector, Australian households are not stretched, but there are limits. Some households have already reached that limit. Some have surpassed it.
What about Australia’s net foreign debt?
As at December 2012, Australia’s net foreign debt stood at $760 billion, of which only 18.3% was government borrowing. Australia’s foreign debts are predominantly private. They are the borrowings by banks to lend for mortgages and other lending, plus offshore borrowings by other Australian companies. Annual interest payments on this debt amount to $21.6 billion or 1.5% of GDP.
New foreign debt is created each year if the demand for loans in the economy outstrips the nation’s savings. The difference is made up by borrowing offshore and results in what is known as the current account deficit.
National issues such as debt levels and current account deficits should not be treated lightly, but neither should they be demonised. Public policy must encourage saving and we must retain the confidence of offshore capital markets. If the global financial crisis taught us anything it was that confidence and trust can evaporate overnight, leaving those with excessive debt badly exposed to financial trauma.
To paraphrase another saying, there are only two certainties in life: debt and taxes.
Thanks for the assistance of Hans Kunnen, Chief Economist at St George Bank and formerly Head of Investor Markets Research at Colonial First State and Chief Economist at the State Bank of NSW.