There are compelling reasons for Australian investors to make a modest allocation to global small capitalisation (cap) equities as a complement to large caps in a diversified portfolio.
As the aggregate pool of assets in Australian superannuation grows through mandatory contributions, investors have to consider moving greater exposure outside Australia. This has been led mostly through global large cap or global all cap investment strategies. However, a dedicated allocation to global small caps is an opportunity due to persistent excess returns evident over the last 10 to 15 years.
The size of the global small cap universe depends on the range of definitions reflected in the cut-offs used for maximum company size in various listed market indices. These range from US$2 billion up to US$5 billion.
For developed countries, a commonly-used index is the MSCI World Small Cap Index ex Aus (‘MSCI WSC’) which at A$6.4 trillion represents about 13% of the total listed global equities market of A$49.3 trillion. For MSCI WSC, there are currently 4,191 stocks in the index which indicates the vast number of possible investments.
The complementary developed countries large cap index is the MSCI World Large Cap Index (‘MSCI WLC’) which accounts for 84% of the total universe. In this index, there are currently only 1,581 stocks listed.
Global small caps add diversity
It is useful to compare sector and regional weightings to show how global small caps add diversity to investor portfolios:
- Global small caps (MSCI WSC) currently have proportionally larger weights in industrials, financials, materials and consumer discretionary. The large caps (MSCI WLC) have major weights in consumer staples, energy, healthcare and telecom services.
- MSCI WSC, compared to large caps, currently have proportionally larger weight in Japan and Pacific ex Japan and less in the US and Europe.
- Comparing MSCI WSC with the sector weightings in Australia’s small ordinaries index shows Australia proportionally has over-weightings in materials, consumer discretionary and to a lesser extent telecoms.
Over the last 15 years, compared to other to other asset classes (in AUD terms), global small caps have been less volatile and generated better returns than Australian small caps and global emerging markets equities (in particular). As shown below, over time, global small caps have outperformed global large caps, particularly as the global equities bull market commenced after the global financial crisis in March 2009. However, there was a period of significant underperformance during the tech boom period of 1999-2000.
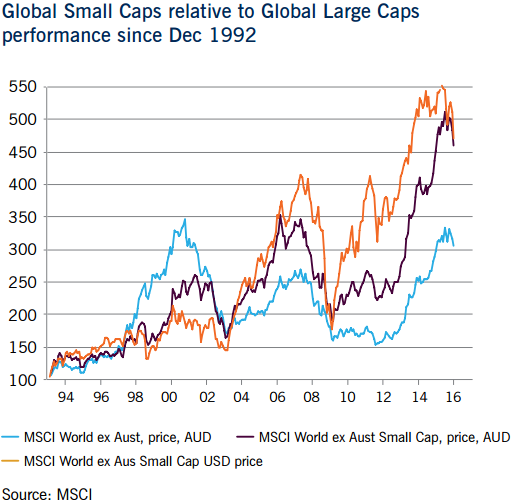
The graph also shows the currency impact for global small caps (includes both AUD and USD terms).? The fall in the Australian dollar over the last few years significantly boosted USD returns which was the reverse of the 1998-2002 period.
As would be expected, global small-caps tend to be less liquid and more peripheral in investor portfolios (that is, have a higher ‘beta’) and are more volatile in both up and down markets. Australian small caps (the orange line on the chart) have a different volatility pattern, reflecting the boom-bust commodity cycle.
Allocations to small caps
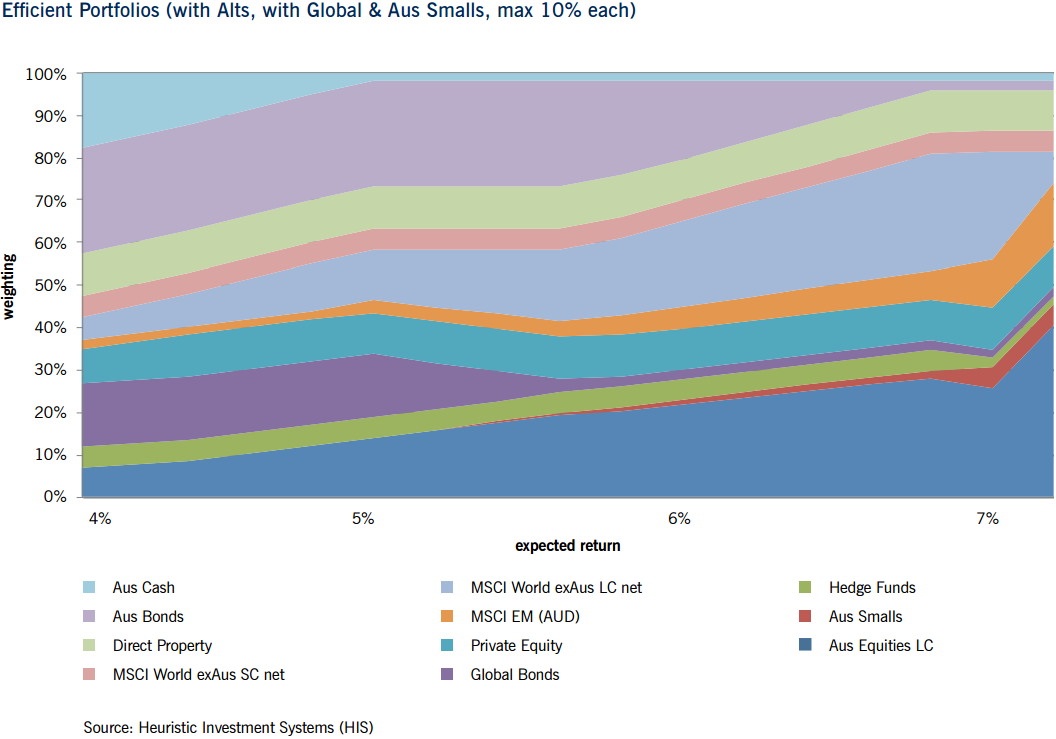
Based on assumptions and modeling work, we estimated a range of efficient portfolios allowing the strategic weightings to global and Australian small caps to maximise at 5%. The chart below shows the combination of optimal portfolios for expected return with the asset class weighting on the left axis. Asset classes are shown in various colours.
The illustration below shows that for virtually all expected return projections, it is warranted to hold a 5% weighting in global small caps (shown in pink). Australian small caps (shown in red) start to appear in the model simulation around 6% and grow to the 5% maximum at 7% expected return. If account is made for Australian dividend imputation then the optimal weighting would be lower, say at 3%.
Click to enlarge
Case for active management
As the MSCI WSC index currently includes 4,191 stocks, it is not highly concentrated, and active fund managers can construct well-diversified portfolios with high active share.
Analysis of global small cap manager returns (using a large USD data set) shows that managers that are in the 25th percentile and above (according to eVestment data covering the last 10 years to 31/12/2015) are consistently able to generate alpha (excess returns) of around 3% plus which is well above the median. The last three years have been particularly good for active fund managers with the higher performers generating excess returns between 3% and 9%.
There is a wide dispersion in manager returns over all time periods. This supports the view that managers need to actively manage their risks across a range of dimensions, particularly liquidity, unintended sector and macro positions, stock quality and currency.
Overall, there are sound reasons, supported by comparative market, asset class optimisation and manager return analysis, to maintain a significant strategic weighting in global small caps - up to 5% - in a well-diversified Australian balanced portfolio.
Nigel Douglas is Chief Executive Officer of Douglas Funds Consulting Pty Ltd, drawing on statistical analysis by asset allocation specialist research firm Heuristic Investment Systems and Eaton Vance Management (International) (EVMI). This article is general information and does not address the circumstances of any individual.