Register For Our Mailing List

Register to receive our free weekly newsletter including editorials.

Home / 216

2. Drilling down into latest SMSF allocations

There is a long-running debate about SMSF exposure to global equities, driven by the misleading interpretation of the data issued by the Australian Taxation Office. The ATO only lists direct holdings on global exchanges in its international equities allocation, and this number misses the billions held by SMSFs in managed funds, Exchange Traded Funds and Listed Investment Companies. Drilling into the actual fund data, SMSF allocation to international equities is about 7%, which is one-third of the 23% allocated by large institutional funds, but much higher than the 1% suggested by the ATO data.

Drilling deeper into the listed trust allocation

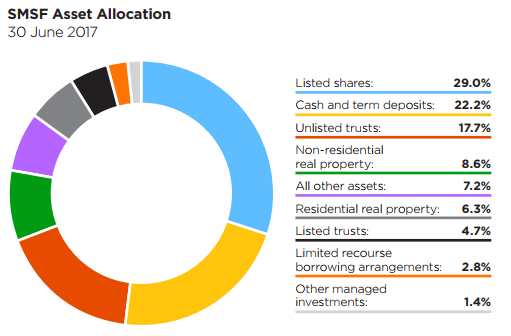
Compensating for the ATO data weakness is the Class Limited SMSF Benchmark Report. We have early access to the June 2017 numbers compiled from over 130,000 SMSFs using de-identified fund-level data. Initially, for consistency with the ATO data, Class uses the same asset allocation categories, as shown below.

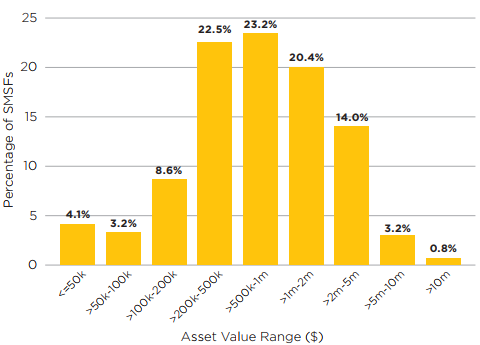
Class also provides the asset value ranges of SMSFs, showing some very small and very large balances but two-thirds in the $200,000 to $2 million bands.

Where the first chart above reports listed shares at 29%, like the ATO data, the vast majority of these shares are listed on the ASX. It is the unlisted trusts category at 17.7% of assets and the listed trusts at 4.5% of assets where the global equities lie. In these SMSFs, managed funds comprise 11.5% of assets, with 32% of SMSFs holding some type of managed fund.

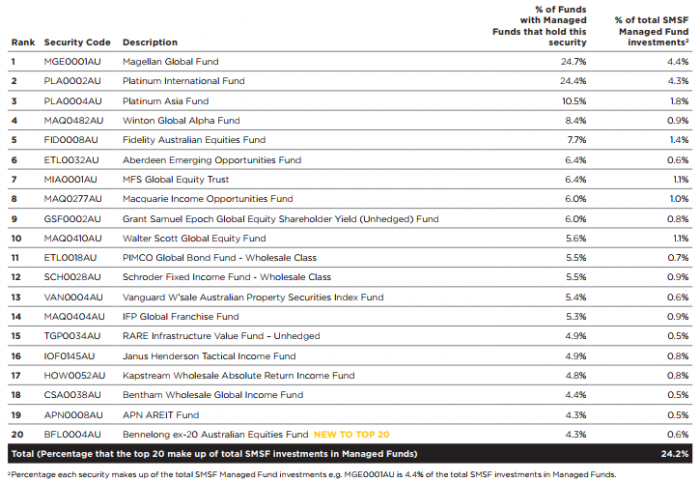
The asset exposure of the Top 20 managed funds is 58% international equities, 10% Australian fixed interest, 9% cash, 8% global fixed interest and 5% listed property. Only 8% is Australian equities. A 58% allocation of the 11.5% in managed funds places 6.7% in global assets.

As shown below, the Top 20 managed funds are prominent in many SMSFs, with about a quarter of SMSFs with managed funds holding investments with either Magellan or Platinum.

Direct equities by security

The Class data reports the largest asset allocation is to listed domestic equities (including listed trusts) at 37% of SMSF assets, with a place in 68% of all SMSFs.

The domestic listed assets comprise:

  • Shares 78.5%
  • Debt and hybrids 9.0%
  • Stapled securities 6%
  • ETFs 5.9%
  • Other listed trusts 0.6%

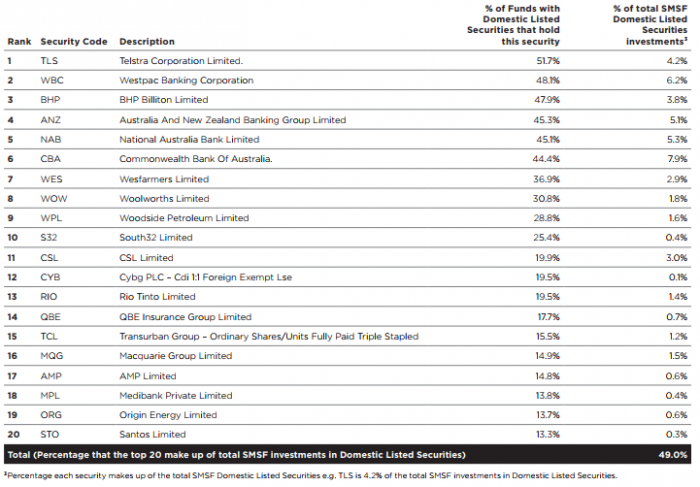
The following table shows the Top 20 shares in SMSF portfolios. Over half of all SMSFs that hold domestic shares have experienced the Telstra pain of a halving in the share price and cut in dividend. The banks make up over half the investments in the Top 20, with Westpac overtaking BHP in the last quarter.

Graham Hand is Managing Editor of Cuffelinks. Exclusive access to the Class SMSF Benchmark Report for June 2017 was provided by Class Super.

RELATED ARTICLES

Which shares and funds do SMSFs invest in?

What is happening with SMSFs? Part 2

Are SMSFs getting too much of a free ride?

banner

Most viewed in recent weeks

Are LICs licked?

LICs are continuing to struggle with large discounts and frustrated investors are wondering whether it’s worth holding onto them. This explains why the next 6-12 months will be make or break for many LICs.

Retirement income expectations hit new highs

Younger Australians think they’ll need $100k a year in retirement - nearly double what current retirees spend. Expectations are rising fast, but are they realistic or just another case of lifestyle inflation?

Welcome to Firstlinks Edition 627 with weekend update

This week, I got the news that my mother has dementia. It came shortly after my father received the same diagnosis. This is a meditation on getting old and my regrets in not getting my parents’ affairs in order sooner.

  • 4 September 2025

5 charts every retiree must see…

Retirement can be daunting for Australians facing financial uncertainty. Understand your goals, longevity challenges, inflation impacts, market risks, and components of retirement income with these crucial charts.

Why super returns may be heading lower

Five mega trends point to risks of a more inflation prone and lower growth environment. This, along with rich market valuations, should constrain medium term superannuation returns to around 5% per annum.

Super crosses the retirement Rubicon

Australia's superannuation system faces a 'Rubicon' moment, a turning point where the focus is shifting from accumulation phase to retirement readiness, but unfortunately, many funds are not rising to the challenge.

Latest Updates

Investment strategies

Why I dislike dividend stocks

If you need income then buying dividend stocks makes perfect sense. But if you don’t then it makes little sense because it’s likely to limit building real wealth. Here’s what you should do instead.

Superannuation

Meg on SMSFs: Indexation of Division 296 tax isn't enough

Labor is reviewing the $3 million super tax's most contentious aspects: lack of indexation and the tax on unrealised gains. Those fighting for change shouldn’t just settle for indexation of the threshold.

Shares

Will ASX dividends rise over the next 12 months?

Market forecasts for ASX dividend yields are at a 30-year low amid fears about the economy and the capacity for banks and resource companies to pay higher dividends. This pessimism seems overdone.

Shares

Expensive market valuations may make sense

World share markets seem toppy at first glance, though digging deeper reveals important nuances. While the top 2% of stocks are pricey, they're also growing faster, and the remaining 98% are inexpensive versus history.

Fixed interest

The end of the strong US dollar cycle

The US dollar’s overvaluation, weaker fundamentals, and crowded positioning point to further downside. Diversifying into non-US equities and emerging market debt may offer opportunities for global investors.

Investment strategies

Today’s case for floating rate notes

Market volatility and uncertainty in 2025 prompt the need for a diversified portfolio. Floating Rate Notes offer stability, income, and protection against interest rate risks, making them a valuable investment option.

Strategy

Breaking down recent footy finals by the numbers

In a first, 2025 saw AFL and NRL minor premiers both go out in straight sets. AFL data suggests the pre-finals bye is weakening the stranglehold of top-4 sides more than ever before.

Sponsors

Alliances

© 2025 Morningstar, Inc. All rights reserved.

Disclaimer
The data, research and opinions provided here are for information purposes; are not an offer to buy or sell a security; and are not warranted to be correct, complete or accurate. Morningstar, its affiliates, and third-party content providers are not responsible for any investment decisions, damages or losses resulting from, or related to, the data and analyses or their use. To the extent any content is general advice, it has been prepared for clients of Morningstar Australasia Pty Ltd (ABN: 95 090 665 544, AFSL: 240892), without reference to your financial objectives, situation or needs. For more information refer to our Financial Services Guide. You should consider the advice in light of these matters and if applicable, the relevant Product Disclosure Statement before making any decision to invest. Past performance does not necessarily indicate a financial product’s future performance. To obtain advice tailored to your situation, contact a professional financial adviser. Articles are current as at date of publication.
This website contains information and opinions provided by third parties. Inclusion of this information does not necessarily represent Morningstar’s positions, strategies or opinions and should not be considered an endorsement by Morningstar.