Register For Our Mailing List

Register to receive our free weekly newsletter including editorials.

Home / 192

Reduce drawdowns by using Allocation Switch

Investors have a problem. Strategic Asset Allocation (SAA) does not sufficiently protect capital on the downside during stock market crashes, when protection is most needed. Unfortunately, most stocks crash together, regardless of their quality, sector or region.

This analysis uses US market data but it applies to a significant extent to the Australian market, and the lessons are the same.

Investors tend to ‘follow the market’ with their equities asset allocation. They buy more shares at the top of the market just before it falls and sell at the bottom when the market is about to recover.

Allocation Switch is a powerful risk mitigation tool

Investors should switch SAA in line with corporate profits growth trends. The allocation should be more defensive when profit growth is weak and towards a growth option when profits are clearly rising.

The Allocation Switch methodology requires switching the SAA every one to five years. The long periods between SAA switches make the strategy a powerful risk mitigation tool that financial advisers can use at their annual client reviews.

Allocation Switch follows the profits

Switching from ‘follow the market’ with asset allocations to ‘follow the profits’ is summarised in this graphic:

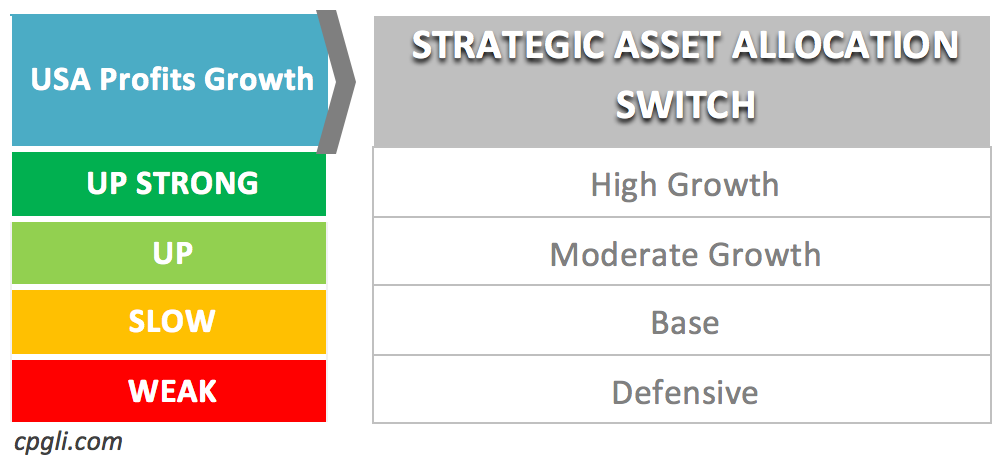
The Allocation Switch is particularly applicable to risk tolerant investors, who choose as default a High Growth SAA with maximum exposure to equities. Any switch by high growth investors can only reduce allocation to risky equities and, hence, reduce portfolio drawdown. Reduction in shares allocation can also result in lower returns but investors value downside protection more.

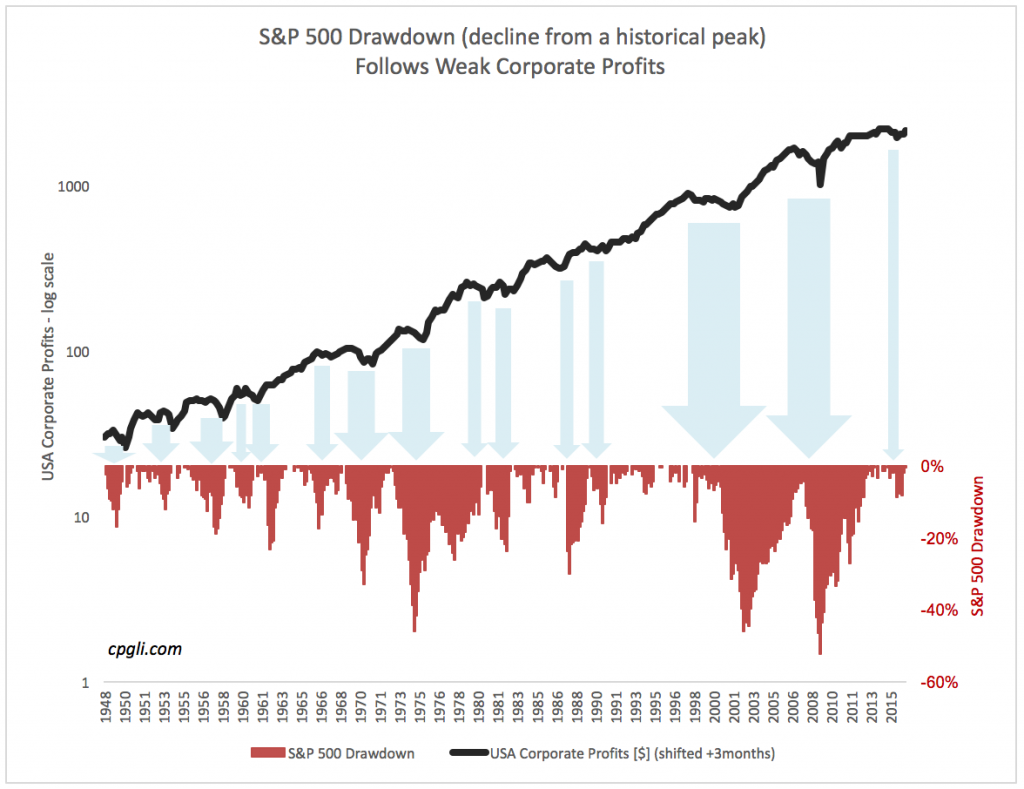
Historically, almost half of the ‘weak’ profits growth periods experienced a stock market crash with falls exceeding 20%. Chasing the last profits in a cycle with exposure to large drawdown is not worth it. The drawdown (defined as a decline in the market from an historical peak) deepened when profits growth was weaker, as shown the chart below.

No need to forecast

There are models that attempt to forecast profits growth. However, to implement the Allocation Switch in its basic form, investors can watch actual quarterly profits and switch the allocation in line with the main emerging profit trends.

Over the past 70 years, the corporate profits for the whole USA economy were over 90% correlated with the S&P500 index, a representative of the broad USA equities exposure. Two lines trending together on the chart below depict the fundamental relationship during and post GFC.

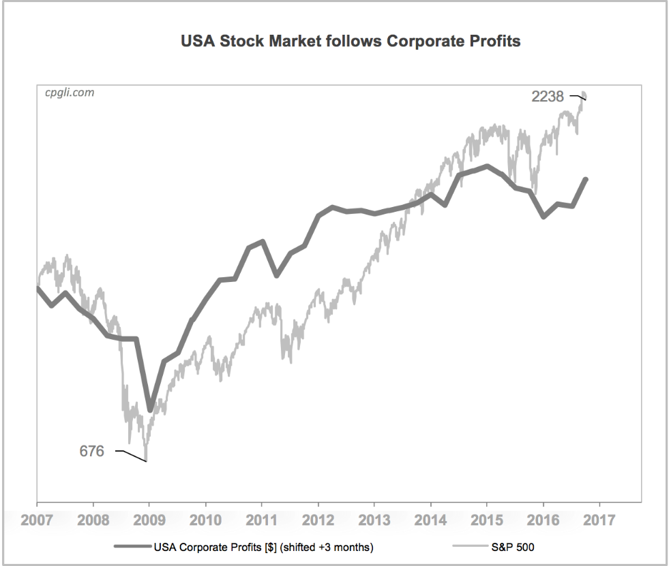
The profits indicated on the chart are the seasonally adjusted National Income and Product Accounts (NIPA) Corporate Profits. They are calculated quarterly by the USA Government Bureau of Economic Analysis (www.bea.gov).

An SAA that is matched initially to the client’s risk profile (call it a ‘Base’ SAA) requires committing to the static asset allocation for the long term, typically 10 years. This commitment is in the hope that all asset classes should return their historical averages over time. In reality, the static SAA mantra of ‘staying put’ is not practiced by individual or professional investors, who quite often switch their asset allocation at a wrong time.

The Allocation Switch, based on corporate profits, calls for moving up or down (i.e. more or less exposure to equities) from the Base SAA option in response to changing market risk. It provides investors and their advisers with a rational tool to stop them making the wrong emotional re-allocation choices. In the process, application of the Allocation Switch to the initial Base SAA should reduce portfolio drawdown.

Investors sell at the worst time

Allocation adjustments are made irrationally at the wrong time by investors responding emotionally to extreme stock market swings, resulting in painful losses. Financial advisers are usually not involved in making re-allocation decisions but rather are blamed by investors for not trying earlier to protect them on the downside. Investors tend to panic when the stock market crashes 20% to 50% and many sell at the worst time.

Professional investment strategists who advise large fund managers are on average no different to individual investors in this regard. Perhaps they are also reluctant to stand up against the prevailing mood of the market, influenced by their fiduciary duties.

For example, consensus allocation to stocks on the chart below was reduced in line with the falling stock market through to early 2009 and then only gradually increased with the rising market.

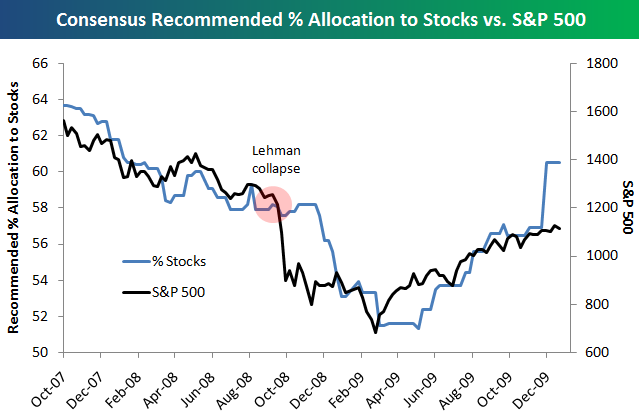
Source: Bespoke Investment Group, Bloomberg Survey of Wall Street Strategists, Jan 2010. Reproduced with permission.

The point of lowest allocation to equities coincided with the March 2009 market bottom. Looking back, it was the best time to switch to a High Growth SAA option at the beginning of the multi-year V-shape rally.

Perception of risk depends on the state of the market

The SAA methodology measures risk in terms of a long-term historical average volatility without referring to current valuations. It implies that the market can move in either direction by the same magnitude from any entry price point.

But surely, the entry price does matter. And one does not need to forecast the market to know that the risk of a fall is bigger at very high valuations because history shows that markets are cyclical. Yet, static SAA expects the same allocation to equities at both low and high valuation entry points. Clearly, there is a need for rational asset re-allocation tools. Investors look at the drawdown of their portfolios on a given day when they think about their downside risk. Investors’ perception of risk changes with market performance.

Warren Buffett, among others, illustrated how irrational investor behaviour is. When we see a ‘sale’ sign in a shop, we rush to buy more of the goods at discounted prices and when prices rise we buy less. However, when it comes to the stock market, we do the reverse: we buy less when shares are cheap after a crash and buy more when shares are expensive and likely to fall. That is how humans react to painful loss thus there is a clear need for rational tools to counter such irrational and costly behaviour.


George Bijak, MBA, is Director, Investment Strategy for Sydney-based GB Capital Pty Ltd, see www.cpgli.com. This article is for general educational purposes and does not consider the circumstances of any investor.

14 Comments
Kevin
March 08, 2017

Hiya George

Thankyou for your reply,I really enjoyed reading it and I will enjoy the thinking that it will make me do.

The emotional side of investing is and can be very extreme.I do have tremendous conviction and am well aware that 200 yrs of history proves nothing and WBC can go bust (1990 -1992).The mental strength that that conviction brings does mean I have no problem with concentrated portfolios.

I realise it is not for everyone and your comment on a low cost ETF whether it is sector specific or market in general,I could not agree more.History proves that very few people stay the course.I have yet to work out if having that mental strength makes me a good investor,or a really dumb one with too much optimism.

I will read the article when I have time,what you say is correct,easily proved by maths.If everyone bought shares in WBC nobody would be wealthy,there are not enough shares for everyone to have a large holding.

We will never be able to pick the bottom or top.I have got close twice in 2 stocks (CBA and LLC),probably luck rather than skill.As I hold forever I have never tried to pick top,but I am sure I would fail.

For 2 days during the GFC I had serious doubts,5 and 6 march 2009 .I got closer and closer to a margin call.I seriously thought of liquidating everything,I kept myself going by concentrating on the cash dividends that would come from CBA at the end of march,that would ease the tremendous pressure I was under.I realised I had made a mess of it and it would be really stupid to sell out at what may or may not have proved to be bottom.I cut myself off from all news ,internet etc for 1 week.I never want to have that pressure again.

I stopped all DRP to get some cash up.For 2 years I missed increasing my shareholdings,it taught me I needed cash just for that black swan event that I did not expect would be that bad.A wonderful education for me,thankfully after my week of isolation markets had turned (basically CBA).Gut feeling was it is over,thankfully it was.I do not know what I would have done,I never want to go through it again.I do think it made me even stronger(or dumber) mentally.

I have never understood the drawdown bit,for most people I can see it.For myself I cannot.My dividend income is high,I don't need to ever sell.I am very aware it can go against me.To quote Carnegie, all eggs in one basket and watch that basket very very carefully.Ben Graham, leave a good margin for error,I think I have (fingers crossed).

Once again thankyou for your reply,I may get many weeks of thinking out of it.Exploring new avenues.It is all such good fun,tap dancing in retirement (not work)

George Bijak
March 09, 2017

Kevin, thanks for sharing your experience.
Today's article also talks about banks in relation to housing - you may find it interesting:
http://cuffelinks.com.au/housing-construction-long-last/

George Bijak
March 04, 2017

Kevin, coincidently when you posted the comment, I was re-reading Ashley Owen’s article posing a big question ‘If every long term investor in the world has pretty much the same goals for their investments, and if they all have access to pretty much the same investments globally, then why are there so many different and completely opposite views on how to use those same investments to achieve the same investment goals? – see his article here http://cuffelinks.com.au/big-question-asset-allocation/.

The concept of many ‘tin gods’ out there adds to the open discussion. Your philosophy of ‘buying when the blood flows freely on the streets and holding for a long time’ is conceptually valid because markets are cyclical and rising over time. Although, who can be sure where is the bottom in the absence of other tools? And how many investors can withstand the wild market volatility along the way?

The one stock strategy requires a very strong conviction that the company will survive every downturn, changing management and business environment. It would be safer to diversify across a segment that you favour; perhaps via a low fee index funds or ETFs. Think about Bear Stearns and Lehman Brothers collapse in 2008 while the banking sector recovered from the global crisis.

The cycle lives on; there should be more opportunities to buy quality companies at very distressed prices. The question remains whether you will hold your nerves when the market crashes again and again by 20-50%. Will you be able to hold to your shares during such big downturns? Most investors would not, as history shows, and they would sell on the way down. Those risk-averse investors should search for tools that would help them make more rational decisions on when to take some risk of the table in order to improve their chances of reducing drawdowns.

Jerome Lander
March 03, 2017

SAA is deeply flawed and suboptimal as the author says. But the approach is at serious risk of confusing correlation wtih causation.
Managing risk rather than forecasting return, and better portfolio construction are superior alternatives.

George Bijak
March 03, 2017

And how the ‘better portfolio construction’ performed during the GFC?
What do we tell investors who lost 30% of their capital in a well-diversified uncorrelated portfolio?

Most portfolios are constructed using average historical correlations but during a crisis the correlations change.

SAA and portfolio construction methodologies also involve forecasting: they assume the future will be like the average past. Or will it?

For example, the past 30 or so years of falling interest rates propelled both equities and bonds values. The mid-term future is likely to see flat or slightly rising interest rates. This will change the historical correlation between equities and bonds. While shares could still rise due to profits growth the bonds values will fall with rising rates – reversing the past 30-year correlation.

The answer from SAA and portfolios constructed using statistical averages is always the same: just hold for long enough and the portfolio will recover. The problem is the investors do not stay put when they see their capital rapidly shrinking. They act and act irrationally. That is why I developed the Allocation Switch tool which aims to pro-actively protect the capital.

George Bijak
March 03, 2017

Jerome, the Allocation Switch is not the answer by itself – it works together with the Strategic Asset Allocation and Portfolio Construction models in the effort to mitigate risk.

David
March 02, 2017

Using indicators which are lagged can look very good in a backtest.

George Bijak
March 02, 2017

Hi Phil, I use seasonally adjusted Corporate Profits for the whole economy; not for stocks which are more volatile.
The CPgLI forward indicator is updated quarterly but the profits trend changes less often - typically every 1 to 5 years. The rebalancing does not cost much and is simple: you just switch the Strategic Asset Allocation option down or up the risk scale.

Phil Brady
March 02, 2017

Thank you.

George Bijak
March 02, 2017

Yes David, the actual track record is more credible than a backtest.

Kevin
March 04, 2017

Thank you for your time and analysis.

The human race is not rational,never has been ,never will be.

What fascinates me is track record,and the learning curve I have been on for 30 yrs.

All the advice and arguing, and my tin god is better than your tin god, and so on.

I like reality,I bought WBC around the time of the SGC starting @ 9%.The price had fallen from around $15 to $12.So I bought,,the time to buy is when the blood flows freely on the streets (Rothschild, 300 yrs ago?).

WBC is 200yrs old this year,200 yrs of panic and advice of never just buy 1 stock.A fortune has been made over those 200 yrs by doing nothing.

Over 40 yrs (so 2042) that outlay of $12000 to buy 1,000 shares will (should )really grow,using the DRP. I think it may well outperform super.All those fees and charges,all the conflicting advice,All the NEVER DO THAT.Takes somebody from the age of 30 to the age of 70

200 yrs of history proves nothing,the risk is still the same.There is a chance that WBC can go bust.Looking in the rear view mirror tells us nothing except what did happen.It may or may not repeat in the future,we don't know.

Why does nobody take a chance on that.Why do we put so much faith in the tin gods we create for ourselves.

This is not any criticism of anything you have said or did,just food for thought..

What would your thoughts be?

Thankyou.

Ashley Owen
March 01, 2017

Story does a good job of describing one particular method. Problem is that profit reports are backward-looking but share prices are forward-looking. So by the time profit growth has been reported, share prices are already booming.
Because of these lags the best share price growth is often when big losses are being reported (late recessions/ early recoveries) – eg 2009 was the year of reporting the big GFC losses, but 2009 was a great year for share prices.
It is the same with the reverse situation – the big profit years are at the end of booms when interest rate hikes in late booms have already hit share prices. Eg FY 2008 was a great year for Aust profits but shares crashed.
By the time the losses were announced in the Dec half year (our Feb) and June 2009 FY (out in Aug 2009) the stock market rocketed up 2009. Same in the 1990-1 recession – by the time the big losses were announced (mainly from Westpac and ANZ) the rebound was already underway. Same in the 1980-3 recession – by the time the big losses and profit hits for 1982 (eg BHP eps down 48%, BNSW eps down, CSR eps down 28%, Leighton eps down 32%, etc) were reported in 1983, share prices were already rebounding – in fact 1983 was the best year ever for Aust shares – late in the 1980-3 recession and profit slump. By the time the profit rebounds were reported the rally was over.
So probably because of these critical timing differences and lags the strategy would under-perform an automatic rebalancing or even a random rebalancing. But he is right in saying most investors overweight at the top of booms and sell out at the bottom.

George Bijak
March 02, 2017

That is right - the profit reports are backward looking. That is why the Allocation Switch strategy uses quarterly forward looking Corporate Profits Growth Leading Indicator to capture the turning points early. The strategy worked well for the past 10 years and was back-tested on the prior 60 years.

Surprisingly, the USA stock market is quite well aligned with its profits especially at the bottoms – March 2009 is a good example. Other countries, including Australia, tend to follow the dominant US market often disregarding their own economic fundamentals.
What happened in 2008 illustrates the pattern. Both Australian and the USA stock markets were falling despite rising Australian profits. So, Australian investors would benefit from observing the USA profit trends.

Phil Brady
March 02, 2017

Hi George, there is lots of data to say that analysts earnings forecasts almost always start off very optimistic and then downgrade, how do you allow for this? And using quarterly forward looking - are you saying looking forward only 1 quarter? seems like a very short term and lots of rebalancing required, leading to costs.


Leave a Comment:

banner

Most viewed in recent weeks

2024/25 super thresholds – key changes and implications

The ATO has released all the superannuation rates and thresholds that will apply from 1 July 2024. Here's what’s changing and what’s not, and some key considerations and opportunities in the lead up to 30 June and beyond.

Five months on from cancer diagnosis

Life has radically shifted with my brain cancer, and I don’t know if it will ever be the same again. After decades of writing and a dozen years with Firstlinks, I still want to contribute, but exactly how and when I do that is unclear.

Is Australia ready for its population growth over the next decade?

Australia will have 3.7 million more people in a decade's time, though the growth won't be evenly distributed. Over 85s will see the fastest growth, while the number of younger people will barely rise. 

Welcome to Firstlinks Edition 552 with weekend update

Being rich is having a high-paying job and accumulating fancy houses and cars, while being wealthy is owning assets that provide passive income, as well as freedom and flexibility. Knowing the difference can reframe your life.

  • 21 March 2024

Why LICs may be close to bottoming

Investor disgust, consolidation, de-listings, price discounts, activist investors entering - it’s what typically happens at business cycle troughs, and it’s happening to LICs now. That may present a potential opportunity.

The public servants demanding $3m super tax exemption

The $3 million super tax will capture retired, and soon to retire, public servants and politicians who are members of defined benefit superannuation schemes. Lobbying efforts for exemptions to the tax are intensifying.

Latest Updates

Retirement

Uncomfortable truths: The real cost of living in retirement

How useful are the retirement savings and spending targets put out by various groups such as ASFA? Not very, and it's reducing the ability of ordinary retirees to fully understand their retirement income options.

Shares

On the virtue of owning wonderful businesses like CBA

The US market has pummelled Australia's over the past 16 years and for good reason: it has some incredible businesses. Australia does too, but if you want to enjoy US-type returns, you need to know where to look.

Investment strategies

Why bank hybrids are being priced at a premium

As long as the banks have no desire to pay up for term deposit funding - which looks likely for a while yet - investors will continue to pay a premium for the higher yielding, but riskier hybrid instrument.

Investment strategies

The Magnificent Seven's dominance poses ever-growing risks

The rise of the Magnificent Seven and their large weighting in US indices has led to debate about concentration risk in markets. Whatever your view, the crowding into these stocks poses several challenges for global investors.

Strategy

Wealth is more than a number

Money can bolster our joy in real ways. However, if we relentlessly chase wealth at the expense of other facets of well-being, history and science both teach us that it will lead to a hollowing out of life.

The copper bull market may have years to run

The copper market is barrelling towards a significant deficit and price surge over the next few decades that investors should not discount when looking at the potential for artificial intelligence and renewable energy.

Property

Global REITs are on sale

Global REITs have been out of favour for some time. While office remains a concern, the rest of the sector is in good shape and offers compelling value, with many REITs trading below underlying asset replacement costs.

Sponsors

Alliances

© 2024 Morningstar, Inc. All rights reserved.

Disclaimer
The data, research and opinions provided here are for information purposes; are not an offer to buy or sell a security; and are not warranted to be correct, complete or accurate. Morningstar, its affiliates, and third-party content providers are not responsible for any investment decisions, damages or losses resulting from, or related to, the data and analyses or their use. To the extent any content is general advice, it has been prepared for clients of Morningstar Australasia Pty Ltd (ABN: 95 090 665 544, AFSL: 240892), without reference to your financial objectives, situation or needs. For more information refer to our Financial Services Guide. You should consider the advice in light of these matters and if applicable, the relevant Product Disclosure Statement before making any decision to invest. Past performance does not necessarily indicate a financial product’s future performance. To obtain advice tailored to your situation, contact a professional financial adviser. Articles are current as at date of publication.
This website contains information and opinions provided by third parties. Inclusion of this information does not necessarily represent Morningstar’s positions, strategies or opinions and should not be considered an endorsement by Morningstar.