Register For Our Mailing List

Register to receive our free weekly newsletter including editorials.

Home / 217

What is the Shiller PE ratio telling us?

The rise in global equity prices in recent years has led to concerns over valuation levels. One indicator that appears to cause endless nervousness is the so-called 'Shiller' PE ratio. While the Shiller PE ratio is a poor short-run market timing tool, it has proven to be a reasonable guide for likely longer-run returns in the past. However, allowance today needs to be made for the large structural decline in interest rates.

The Shiller PE ratio is high

Made famous by Nobel-prize winning economics professor Robert Shiller, the Shiller or 'cyclically adjusted' PE ratio (SPER) compares the level of US share prices to the 10-year moving average level of earnings. The indicator became popular after Shiller used the analysis during the dotcom bubble to suggest the market was overvalued and lower returns could be expected over coming years, and he was eventually proven right!

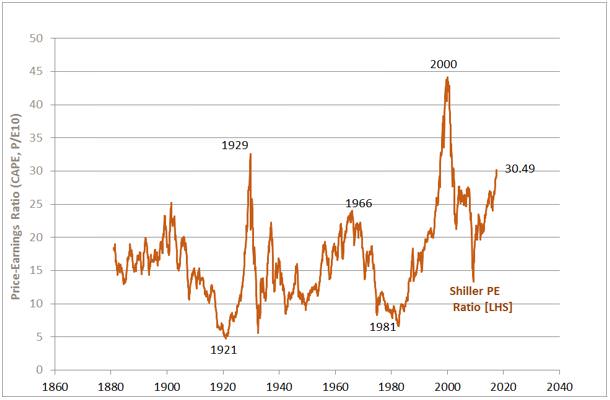
As seen in the chart below, the current level of the SPER is around 30, which is above its average since the 1880s of 16.7. The SPER is higher than during the peak of the late-1960s bull market, and close to the level in 1929 (32.5), but still well below the peak of 44.2 in 1999.

Shiller PE Ratio: 1880 to 2017
Source: Prof. Shiller, Yale University

It’s not a great market timing tool

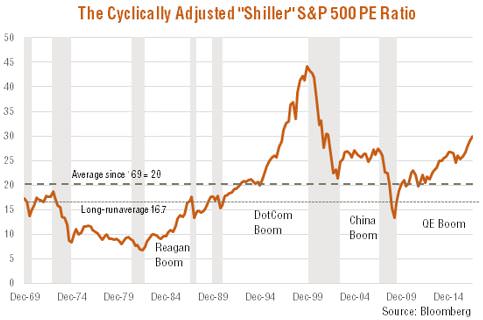
Does this mean the market is about to crash? As seen in the chart below, the SPER has tended to be above average for the much of the past two decades. Indeed, it continued to rise for an extended period through the late 1990s bull market, and hovered above 25 for most of the commodity-driven bull market prior to the financial crisis. As a short-run market timing tool, the SPER has not been much help!
The longer-run outlook for stocks is potentially more sobering

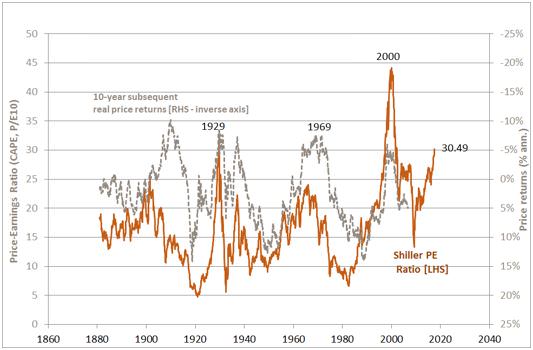
The SPER has had better success as an indicator of longer-run likely returns. As seen in the chart below, relatively high levels of the SPER have tended to be associated with relatively low real share price returns over the following 10-year period. Indeed, the last three times the SPER hit 30 (back in the late 1920s and again twice during the dotcom bust), subsequent 10-year real share prices returns were negative. That does not bode well for likely US share price returns over the coming decade!

Shiller PE Ratio and subsequent 10-year real share price returns
Source: Prof. Shiller, Yale University

A complicating factor in extrapolating historical patterns is the huge cycle of rising then falling interest rates over the past 50 years. Equity markets faced the headwind of rising rates from the 1960s to the early 1980s, then enjoyed the tailwind of falling rates for the past 35 years.

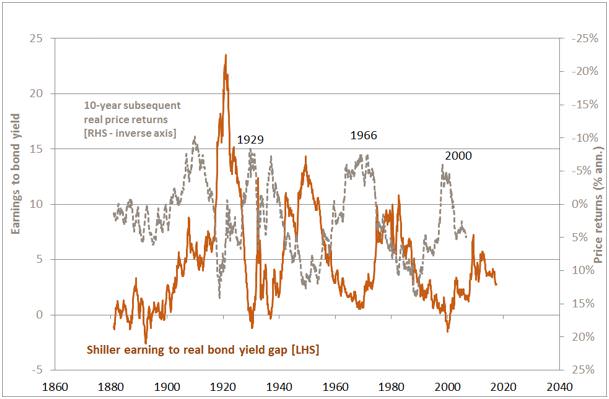
As seen in the chart below, if we invert the SPER to generate a ‘Shiller earnings yield’ and compare this to real bond yields, current equity market valuations appear less troublesome. The Shiller earnings-to-bond yield gap is currently around 2.7% compared with a long-run average of 4.7%, but past periods of weak 10-year real share returns (in 1929, 1966 and 2000) were associated with earnings to bond yield gaps closer to zero.

Shiller Earnings to Real-Bond-Yield Gap and Subsequent 10-year Real Share Price Returns
Source: Prof. Shiller, Yale University

Compared with 1929, 1966 and 2000, this method of stock market valuation is not flashing red.


David Bassanese is Chief Economist at BetaShares, which offers Exchange-Traded Funds listed on the ASX. BetaShares is a sponsor of Cuffelinks. This article contains general information only and does not consider the investment circumstances of any individual.

  •   31 August 2017
  • 2
  •      
  •   

RELATED ARTICLES

Why the tech giants still impress

banner

Most viewed in recent weeks

The growing debt burden of retiring Australians

More Australians are retiring with larger mortgages and less super. This paper explores how unlocking housing wealth can help ease the nation’s growing retirement cashflow crunch.

Four best-ever charts for every adviser and investor

In any year since 1875, if you'd invested in the ASX, turned away and come back eight years later, your average return would be 120% with no negative periods. It's just one of the must-have stats that all investors should know.

Preparing for aged care

Whether for yourself or a family member, it’s never too early to start thinking about aged care. This looks at the best ways to plan ahead, as well as the changes coming to aged care from November 1 this year.

Our experts on Jim Chalmers' super tax backdown

Labor has caved to pressure on key parts of the Division 296 tax, though also added some important nuances. Here are six experts’ views on the changes and what they mean for you.        

LICs vs ETFs – which perform best?

With investor sentiment shifting and ETFs surging ahead, we pit Australia’s biggest LICs against their ETF rivals to see which delivers better returns over the short and long term. The results are revealing.

Family trusts: Are they still worth it?

Family trusts remain a core structure for wealth management, but rising ATO scrutiny and complex compliance raise questions about their ongoing value. Are the benefits still worth the administrative burden?

Latest Updates

Investment strategies

LICs vs ETFs – which perform best?

With investor sentiment shifting and ETFs surging ahead, we pit Australia’s biggest LICs against their ETF rivals to see which delivers better returns over the short and long term. The results are revealing.

Retirement

The growing debt burden of retiring Australians

More Australians are retiring with larger mortgages and less super. This paper explores how unlocking housing wealth can help ease the nation’s growing retirement cashflow crunch.

The ASX is full of broken blue chips

Investing in the ASX 20 or 200 requires vigilance. Blue chips aren’t immune to failure, and the old belief that you can simply hold them forever is outdated. 

Shares

Buying Guzman y Gomez, and not just for the burritos

Adding high-quality compounders at attractive valuations is difficult in an efficient market. However, during the volatile FY25 reporting season, an opportunity arose to increase a position in Mexican fast-food chain GYG.

Investment strategies

Factor investing and how to use ETFs to your advantage

Factor-based ETFs are bridging the gap between active and passive investing, giving investors low-cost access to proven drivers of long-term returns such as quality, value, momentum and dividend yield. 

Strategy

Engineers vs lawyers: the US-China divide that will shape this century

In Breakneck, Dan Wang contrasts China’s “engineering state” with America’s “lawyerly society,” showing how these mindsets drive innovation, dysfunction, and reshape global power amid rising rivalry. 

Retirement

18 rules for ageing well

The rules to age successfully include, 'the unexamined life lasts longer', 'change no more than one-eighth of your life at a time', 'nobody is thinking about you', and 'pursue virtue but don’t sweat it'.

Sponsors

Alliances

© 2025 Morningstar, Inc. All rights reserved.

Disclaimer
The data, research and opinions provided here are for information purposes; are not an offer to buy or sell a security; and are not warranted to be correct, complete or accurate. Morningstar, its affiliates, and third-party content providers are not responsible for any investment decisions, damages or losses resulting from, or related to, the data and analyses or their use. To the extent any content is general advice, it has been prepared for clients of Morningstar Australasia Pty Ltd (ABN: 95 090 665 544, AFSL: 240892), without reference to your financial objectives, situation or needs. For more information refer to our Financial Services Guide. You should consider the advice in light of these matters and if applicable, the relevant Product Disclosure Statement before making any decision to invest. Past performance does not necessarily indicate a financial product’s future performance. To obtain advice tailored to your situation, contact a professional financial adviser. Articles are current as at date of publication.
This website contains information and opinions provided by third parties. Inclusion of this information does not necessarily represent Morningstar’s positions, strategies or opinions and should not be considered an endorsement by Morningstar.