This article was prompted by questions on the Sydney market from one of our readers, Bruce:
I would be most grateful if one of your experts could shed some light on the current housing market in Sydney. As a SMSF investor in the pension phase, I am struggling to understand what is happening. Auction clearance rates over 85%, properties regularly selling before auction or 10-15% over their reserve, the industry arguing that there is an under supply of accommodation and the State Government forcing Councils to approve more dwellings to increase Sydney's population by another 25%. Is it similar to the Dutch Tulips or the South Sea Bubble? Or can we draw on the experience of nation-wide housing bubbles in Japan, Ireland and the US to understand the localised phenomenon of Sydney?
In our IT connected world, why do people want to pay a huge premium to live in Sydney? Has there been a fundamental shift in the inherent value of Sydney to make it as valuable as London, New York or Tokyo? As the family home is the most tax-effective investment you will ever make, does this encourage taxpayers to invest in larger and more expensive properties? What is the outlook for property if wages remain stagnant and the number of people in employment remains the same? How will people be able to service these huge loans without the benefit of rising incomes?
Not a day seems to go by without at least one new headline pointing to a Sydney housing boom. We are often asked why the Sydney market is so strong, how much longer the growth can persist and will it ultimately end in tears. Unfortunately, there are no simple answers.
Most people are quick to point to record low interest rates as the root cause of the Sydney housing boom. With cash and term deposit rates not much higher than the inflation rate, investors are being forced to look elsewhere for yield, and housing (not to mention the blue chips stocks such as the banks and Telstra) appears to be a key beneficiary.
The RBA has pointed out in its March 2015 Financial Stability Review that “ … the composition of new mortgage finance remains skewed to investors … and investor housing loans in NSW have increased by 150% over the past three years and now account for almost half of the value of all housing loan approvals in that State” (see Figure 1).
Figure 1: Housing loans by state: 2007 – 2015
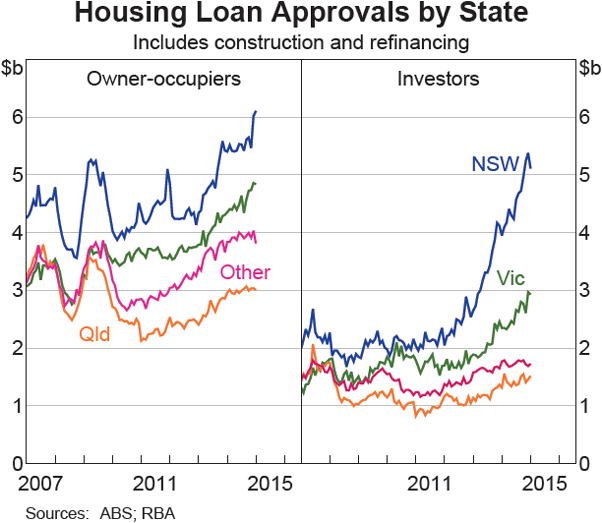
However, low interest rates and heightened investor activity are not the sole drivers of the Sydney housing boom, otherwise we would be in the midst of a housing boom across Australia which, as the latest house price figures from CoreLogic RP Data (Home Value Index) confirm, we are not.
Sydney’s home values were up 13.9% in the year to March 2015 – the only market to record double digit growth. Melbourne was the next best performing market with an annual increase of 5.6% (Figure 2). Surprisingly, Perth, Hobart and Darwin all recorded declines in value of 0.1%, 0.3% and 0.8% respectively.
Figure 2: Annual change in dwelling values: March 2015
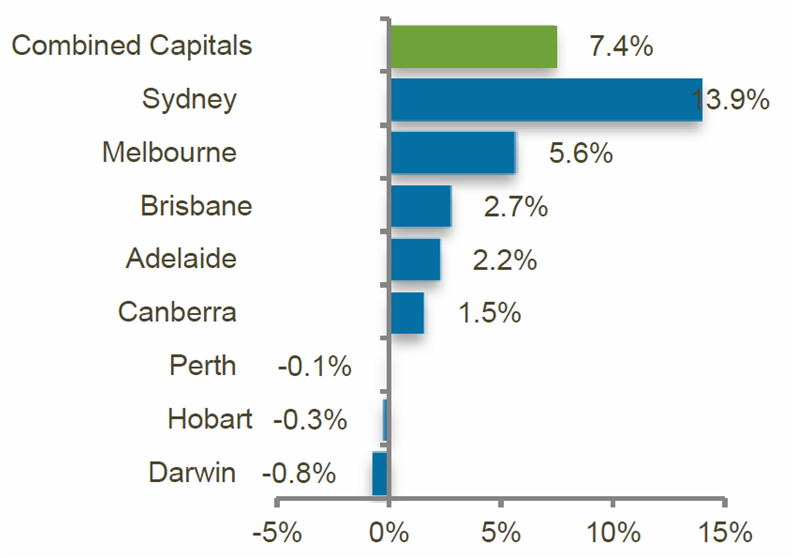
Source: CoreLogic RPData
Looking at home value changes since the last market trough, again price growth has not been uniform across the country (Figure 3). Sydney home values have increased by 38.8%, Melbourne’s are up 23.6%, Perth’s are up 13.2% and Brisbane at 10.9%. Hobart, Canberra and Adelaide have all recorded single digit growth of 8.9%, 8.5% and 8.4% respectively.
Figure 3: Change in dwelling values since the trough to March 2015
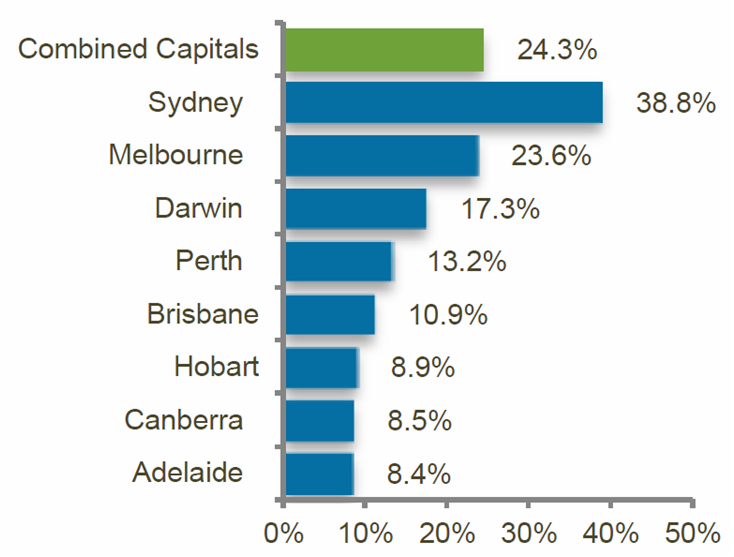
Source: CoreLogic RPData. Note that the ‘trough’ is at different times in different cities.
Therefore, there must be other factors at play that are coming together driving the strength in Sydney house prices. No wonder the RBA has a dilemma. The RBA needs a stronger housing market to offset a downturn in the resource sector yet only Sydney and Melbourne seem to be responding.
Why is Sydney out of step with the rest of the county?
There are seven other factors worth considering:
1. Price catch-up
We need to go back and review the price performance of Sydney over the past ten years to put the recent price movements into a longer term perspective. According to CoreLogic RP Data, Sydney’s annual price growth over the past decade has been relatively subdued at just 4.8% putting Sydney well behind Darwin at 7.5%, Melbourne at 6.3%, and Perth at 6.0% (Figure 4).
Figure 4: Average annual change in dwelling values: 2005 – 2015
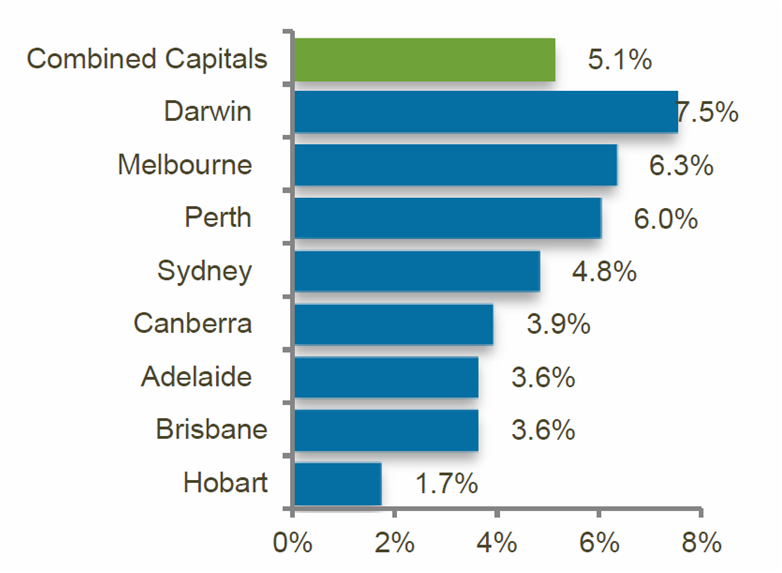
Source: CoreLogic RPData
Sydney housing market did not perform that well in the mid 2000’s and there has been a degree of catch-up between 2012 and 2014. However, the strong market has continued into 2015 and it appears that certain parts of the Sydney market are now overshooting.
2. Fear of Missing Out (FOMO) syndrome
When investment markets (whether property or equities) are running hot there is the natural human physic to jump on the bandwagon commonly known as the 'fear of missing out' syndrome. This is certainly alive and well in Sydney and is partly responsible for fuelling the current price exuberance.
3. Demand and population growth
Sydney is experiencing a population explosion. Annual population growth averaged 1.3% between the early 80’s and mid 2000’s but in recent years has been running at higher levels. According to ABS Regional Population Growth statistics, in the year to June 2014, Sydney’s population increased by 84,200 to 4.84 million – an increase of 1.8%, and above the national average of 1.6%.
Population growth is a combination of international migration, interstate migration and natural growth (births less deaths). Australia’s is running very high international migration levels. Net international migration (arrivals less departures) in the year to June 2014 was around 213,000 – of which 73,300 located in NSW (most whom would have located in Sydney).
When it comes to interstate migration, the level of outflow of residents from NSW to other states has slowed considerably in recent years. In the year to June 2014, there was a net loss of just 6,857 residents. Back in 2004-2005, NSW recorded a net loss of 26,321 people. This means a higher proportion of Sydney residents are now staying, putting further pressure on the demand for housing.
The recent growth in Sydney’s population is set to continue. The NSW State Government is forecasting positive growth for metropolitan Sydney of 1.6% on an annual basis out to 2031 - this equates to population growth of 1.575 million over the 20 year period to 2031, or growth of 78,775 per annum. Therefore, at the current (2011 Census) rate of 2.7 people per household across Sydney, an additional 29,177 new dwellings are required per year to match demand based on past household formation rates.
4. Supply
We simply haven’t been building enough houses in Sydney to meet this demand and this is putting upward pressure on prices.
In the past five years, there have been 195,920 dwelling commencements in NSW compared to 272,243 in Victoria – that’s a staggering 28% less dwellings built in NSW (ABS – 8752.0 Building Activity). In 2011, commencements totalled just 33,433 in NSW compared to 54,606 in Victoria. In 2014, commencement levels were up 47% on 2011 levels, however at 49,313 commencements NSW was still lagging Victoria with 58,330 commencements.
Despite recent efforts by the Baird Government to speed up the release of land, Sydney’s land release program has generally lagged. Sydney also has a convoluted planning process that leads to significant delays and risks in the development process, which adds to the cost of development (higher financing costs and statutory costs such as rates and land tax) which ultimately gets passed on to the price of land and housing. Victoria has a much more transparent planning system and this is one of the key reasons Melbourne has been better able to respond to demand and kept the price of land well below that of Sydney.
Decisive action by both State Government and the 43 councils in Sydney (that is way too many but I’ll leave a discussion of council rationalisation for another day) is required to remove roadblocks and reform the planning system to bring onto the market much-needed new housing supply.
5. Cost of land provision
The cost of providing the basic raw material – land – in Sydney is higher than any other Australian city due to planning delays as noted above and infrastructure charges. According to the HIA – Core Logic RPData Land Report for September 2014, the median residential lot value in Sydney was $320,000 compared to $220,000 in Melbourne.
Historically, the NSW government covered the cost of providing infrastructure for new housing from general tax revenue. Over recent decades, state policies have shifted toward user-funding of infrastructure, which has meant a significant increase in the private cost of development.
Urbis (National Dwelling Cost Study for the National Housing Supply Council - 2011) estimates that in 2010 total government charges (excluding GST) levied on Sydney developers was approximately $60,000 per greenfield dwelling, and between $20,000 and $30,000 per greenfield dwelling in other cities. For infill developments, total government charges levied on developers for greenfield developments are approximately $20,000 to $25,000 per apartment in Sydney and Brisbane and around $10,000 per apartment in Melbourne and Perth.
6. Fragmented land ownership and geographic constraints
The ownership of land on the urban fringe of Sydney is highly fragmented. As Sydney grows, having multiple owners on the fringe makes it more difficult and costly to amalgamate and bring large parcels of land to market.
Unlike Melbourne, Sydney is geographically constrained on all four boundaries by nature which is limiting the release of cheap land on the urban fringe. Some could argue that is a good thing as it prevents even further urban sprawl. But the simple fact is less land availability means higher land prices.
7. Foreign investors
Foreign investor activity in the Sydney market has been rising, reflecting a global search for yield, a lower Australian dollar and the increased interest in Sydney from Asia, particularly China.
It is true that in certain parts of Sydney foreign capital is driving prices higher. Some inner city apartment markets and the higher price point suburbs such as Point Piper in the east and Mosman in the north have witnessed strong price gains off the back of foreign buyer demand.
Despite the hype surrounding foreign investment, the November 2014 House of Representatives’ Standing Committee on Economics Report on foreign investment in residential real estate concluded:
“ ... that foreign investment is not causing the market distortions that have been advocated in some quarters, particularly for first home buyers. This is because foreign investment levels are not large enough to do so overall and because overseas buyers mainly operate at a different price bracket from first home buyers and buy different types of properties.”
We should not forget that a significant component of this international investment is going into new development which is contributing to the increase in supply. The Report also concluded:
“The housing supply issues that have been on-going in Australia would worsen if foreign investment was curtailed. One of the likely outcomes of any restriction on foreign buyers could therefore be further price increases – the opposite to what some in the community believe would occur if foreign investment was further restricted”.
The RBA, which has also downplayed the role of foreign investment in driving house prices, concludes that foreign purchases:
“… are for new, high-density, inner-city properties, as well as properties close to universities. Furthermore, the properties they purchase tend to be valued well above the average national sales price. In contrast, most purchases by first home buyers have been for established homes that are priced well below the national average … and it is, in many ways, not surprising that house prices have gone up, because interest rates are very low, and, as I said, population growth, now at 1.7 per cent a year, is reasonably robust. Those two things help to explain why house prices have gone up.”
Foreign comparisons
Finally, we are increasingly bombarded with overseas commentators pointing out Australian, and in particular Sydney, housing is amongst the most expensive in the world. Whilst on most raw measures it is, one thing these commentators often forget to take into account is our geographic location.
Australia is one of the most urbanised nations in the world, with 80-85% of the population living within 50 kilometres of the coast and 67% living within our capital cities. If we compare the prices of Australia’s capital cities to other global coastal cities, Australia is not that different to other countries. However, when compared on a country-by-country basis Australia, looks expensive because the analysis does not allow for the price differential between coastal and inland locations. Of the top 10 least affordable cities in the world, of which Sydney is one, only London is not a coastal city (Table 1).
Table 1: 10 Least affordable major metropolitan markets: 2015
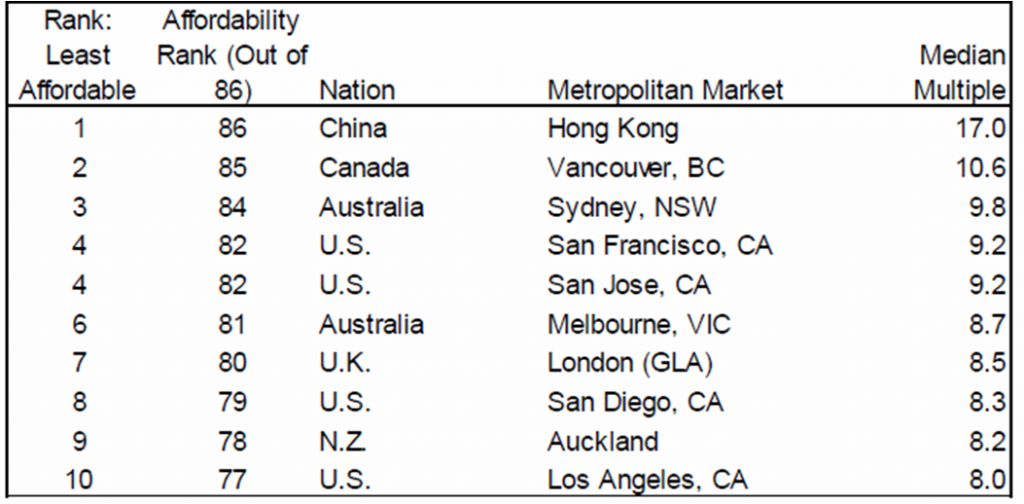
Source: Demographia – 11th Annual Demographia International Housing Affordability Survey: 2015
Conclusion
There is no question that rising prices, auction clearance rates consistently above 80% and falling yields, are pointing to a Sydney housing boom. It is not sustainable but we don’t expect a major price correction for the reasons we have outlined above. Rather we would expect the rate of price growth to slow during the remainder of 2015.
When the Sydney housing market starts to lose momentum, some investors will be left holding a very expensive but low yielding asset with a lower-than-expected rate of capital gain.
Prospective investors would be wise to use some caution when considering an investment in the Sydney market. Just as we pointed out earlier, the national housing market is not homogenous, nor is it within the Sydney market. Sydney is a diverse market accommodating many different buyer preferences and price points. There are certainly pockets now where prices have run too hard and are above fair value and that is where the risk concentrations are being built up. Investors should focus on housing that is well located around good public transport hubs, educational facilities and retail centres.
One caveat on our outlook. With the ratio of household debt to income at record highs, the Sydney market will respond swiftly to any perception of interest rate rises, any contraction in global banking liquidity or government intervention. We welcome the recent moves by APRA and ASIC to increase their surveillance of home lending by banks, especially to investors. Prudent lending is critical to ensuring the strong Sydney market does not end in tears.
Adrian Harrington is Head of Funds Management at Folkestone Limited (ASX code FLK). This article is general information and does not consider the personal circumstances of any investor.