The Australian residential property market creates much consternation. On one level there is the debate about the outlook for home prices with some real estate spruikers still wheeling out versions of the old “property will double every seven years” line versus property doomsters at the other extreme saying it’s overvalued and overindebted and so a crash is inevitable. The problem with the former is that it implies the already high ratio of home prices to incomes will double again over 12 years! The trouble with the doomsters is that they’ve been saying that for decades. On another level there is much understandable angst about affordability with some blaming investors and property tax breaks versus others seeing it as largely due to poor housing supply relative to demand. As always with these things there is no black or white answer. To shed some light on this, here are seven key charts on the state of the housing market.
First – the property cycle looks to be turning up again
After a brief dip of just 0.3%, national average property prices have been rising steadily from February (with Cotality data pointing to another 0.5% rise this month) indicating that they have entered a new cyclical upswing.
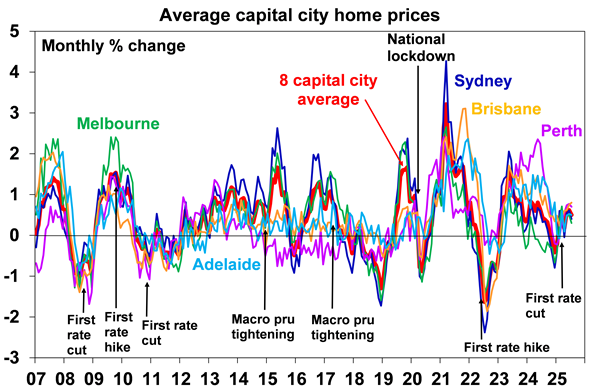
So far, the gains have been broad based with the soft cities of Melbourne, Hobart, Canberra, Darwin and Sydney now picking up at the same time that the boom time cities of Brisbane, Adelaide & Perth remain strong.
Second – interest rates are a key driver
Interest rates matter a lot to the property market because lower rates boost the relative attractiveness of property as an investment and allow home buyers to borrow more. And vice versa for higher rates. Of course, the impact of interest rates can be swamped by other factors at times, as was the case in 2023-24 with the population surge and weak supply. Lower rates are a key driver of the current upswing in prices. As can be seen in the next table, the start of rate cutting cycles since 1982 has been associated with higher home prices over the next 12 and 18 months in five of the last seven rate cutting cycles, providing there is no recession. The average gain over the subsequent 12 and 18 months is 3.9% and 8%. Our base case is for 0.25% RBA rate cuts in August, November, February and May. With increasing signs of labour market weakness, this may occurs faster with back to back cuts in August and September.
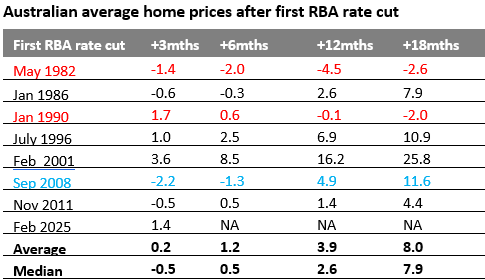
Cotality. Australian recessions are in red. The GFC is in blue. Source: RBA, Cotality, AMP
Third – Australian housing is chronically undersupplied
This has been the case since the mid-2000s when immigration levels, and hence population growth, surged and the supply of new homes did not keep up. Our assessment is that the accumulated housing shortfall (the green line in the next chart) is around 200,000 dwellings at least and possibly 300,000 depending on what is assumed in terms of the number of people per household.
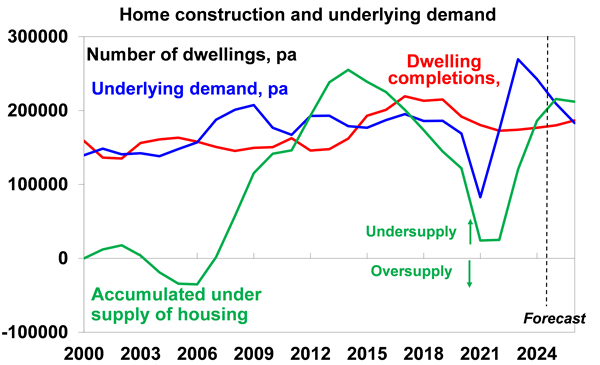
Source: ABS, AMP
The economic reality is that when underlying population driven demand for housing exceeds its supply prices rise and that is what we have been seeing for the last twenty years. The capital gains tax discount, negative gearing and foreign demand may have played a role, but they have been a sideshow to this demand/supply imbalance.
Fourth – home building completion times have surged
Part of the solution is to slow immigration (and hence population) growth to levels more in line with the ability of the housing industry to supply homes. And immigration has been falling lately. But it’s also about boosting supply and if we want to reduce the accumulated undersupply it’s critically important that Federal and state governments retain the Housing Accord commitment to build 240,000 dwellings a year (or 1.2 million over five years), compared to around 180,000 over the last year.
The next chart shows part of the problem. Over the last decade, the time taken to build a house from approval has risen by 57% and for units it has increased by 65%, reflecting increasing regulations, rising costs, labour shortages, etc. To meet the Housing Accord target we need deregulation, measures to boost the number of homebuilders, a greater focus on units and finding more ways to lower costs (like pattern plans in NSW, smaller houses and greater reliance on wood than bricks and concrete).
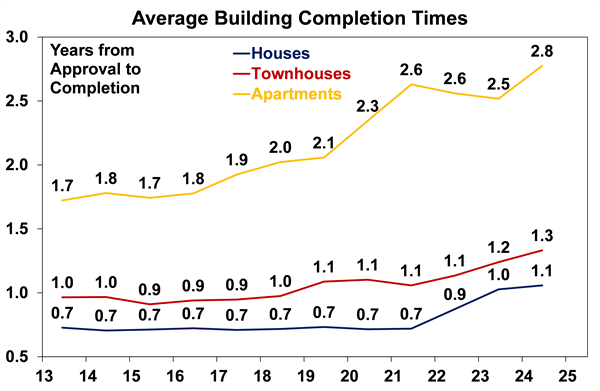
Source: ABS, AMP
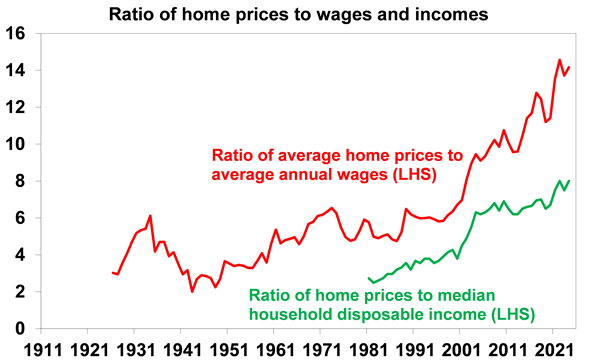
Fifth – Australian housing is very expensive
Chronically deteriorating housing affordability in Australia has been evident since the 1990s. It’s clearly evident in rising home price to wage and household income ratios (with the latter adjusting for the increase in two income families), a rise in the years taken for an average earner to save a 20% deposit from around four years 40 years ago to around 10 now and the ratio of home prices to rents (which is a bit like a PE for shares), adjusted for inflation, being around 30% above its long term average level.
Source: ABS, Cotality, AMP
The expensive nature of Australian property and the high level of debt that goes with it leaves the economy vulnerable should high interest rates or unemployment make it harder to service loans. In the near term though it may constrain the extent of the upswing in property prices through this cycle.
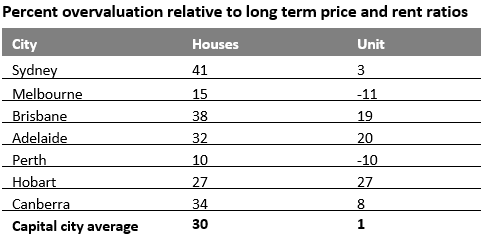
Sixth – it’s also very diverse
While we often refer to 'the Australian property market', in reality there is significant divergence between localities resulting in diverse cycles. The divergence is reflected in measures of valuation. The next table shows the percentage difference between price to annual rent ratios adjusted for inflation relative to their average since 1983. On this basis while houses are 30% overvalued, units are only 1% overvalued. And Perth and interestingly Melbourne stand out as the least overvalued markets in terms of houses and both are actually undervalued in terms of units.
Source: REIA, AMP
Finally – mortgage arrears are still low
Reports of mortgage stress have been common for the last two decades. There is no denying housing affordability is poor, debt is high, and many households are still suffering significant mortgage stress. But despite this, mortgage arrears rates remain remarkably low at less than 1% on average which leaves them low in international comparisons too. They are higher for those with high loan to valuation (LVR) ratios and high loan to income (LTI) ratios but even here they are still low and have been falling lately.
Mortgage Arrears Rates
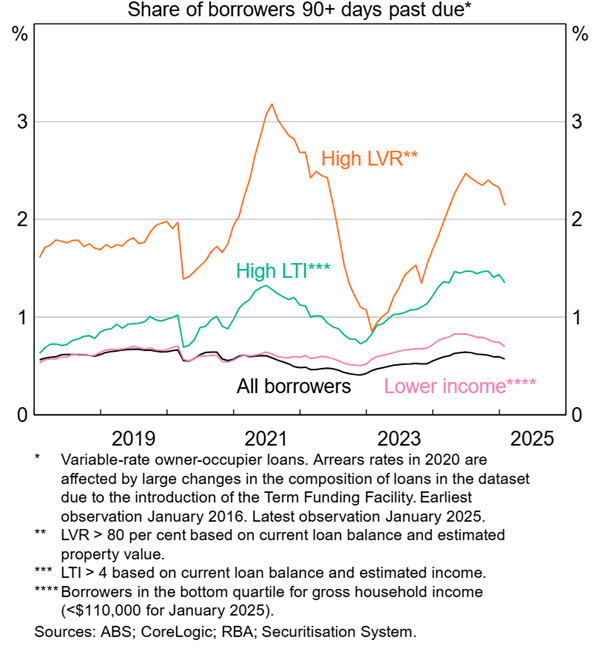
Source: RBA Financial Stability Review, April 2025
The low level of arrears partly reflects strong lending standards in Australia combined with the strong jobs market and a high level of savings buffers coming out of the pandemic. So absent a shock, like much higher unemployment, don’t expect an avalanche of distress listings.
Where to now?
Forecasting property prices is fraught. But our base case is for property prices to rise 5 to 6% this year driven by rate cuts and the chronic housing shortage but with poor affordability constraining the upswing. The main downside risk is that rising unemployment and a delay in rate cuts depresses buyer demand, but the main upside risk is that another bout of FOMO takes hold as rates fall. The key for savvy investors is to look for properties offering decent rental yields.
Dr Shane Oliver is Head of Investment Strategy and Chief Economist at AMP. This article has been prepared for the purpose of providing general information, without taking account of any particular investor’s objectives, financial situation or needs.