Register For Our Mailing List

Register to receive our free weekly newsletter including editorials.

Home / 265

The SMSF gaps in the Productivity Commission’s Superannuation Report

The Productivity Commission’s 571-page ‘Report into Superannuation’ provides some well-researched findings on institutional funds, but it fails to hit the mark on SMSF performance. This is not a reflection on the quality of the Commission’s work, but it is a stark reminder of the inherent differences between how the Australian Prudential Regulation Authority (APRA) and the Australian Tax Office (ATO) report fund performance. We need to highlight and fill in some critical 'SMSF gaps' identified in the Commission’s draft Report.

The disparities in performance reporting result from:

  • The ATO includes contributions tax and insurance costs in net earnings while APRA does not.
  • Given these extra costs, the ATO performance measure will always be worse than APRA’s.
  • The smaller the SMSF balance, the higher the impact of those extra costs.

We have analysed publicly-available contribution tax and insurance data from the ATO to restate SMSF performance so it can be directly compared to institutional fund returns.

For the 10-year period the Commission’s Report covers, SMSFs outperformed APRA funds on a like-for-like basis.

  • In a technical supplement to the Report, the Commission noted that if APRA fund performance is calculated using the ATO method, then SMSFs outperform institutional funds (SMSFs 5.59% compared to 4.98%)
  • The Class submission shows that when SMSF performance is restated using the APRA approach, the amount by which SMSFs outperform institutional funds is even higher (SMSFs 6.71% compared to 5.58%).

The discrepancy around 10-year performance reporting

The Report highlights how institutional funds of different sizes performed over the 10 years from 2006 to 2015. In parallel, the Report should also show how SMSFs starting with different balances (e.g. $1,000 - $50,000 and $51,000 - $100,000) performed over the same period. Instead, they provide a mash-up of one-year performances across the 10 years.

The Commission noted in the Report:

“It is unclear to what extent the presence of small SMSFs in the system is necessarily a problem. It may be that many of these SMSFs will move into higher balance categories over time (or as the upfront capital costs are paid off), although this is difficult to discern given the lack of publicly-available panel data.”

This is highly concerning, given that super is all about saving over the long term, and the industry should be able to compare data on a like-for-like basis.

Class analysis of SMSF performance across five years shows that although funds with smaller balances do generate lower returns, the variance is considerably less than the exaggerated results provided in the draft Report.
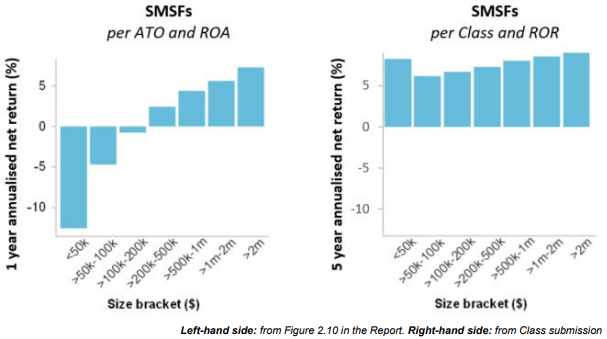
The analysis in the right-hand chart used APRA’s rate of return (ROR) method (as against the ATO’s return on assets (ROA) method) and looked at SMSF performance over the five years from 2013 to 2017. Funds were grouped by their starting balance in 2013.

Long-term fund analysis published by the ATO in the infographic SMSFs first lodged in 2012 FY: where are they five years on? did not include performance data. The ATO should provide a 10-year version of this document and it should include performance for all SMSFs, grouped by their start of year balance in 2006.

A call for collaboration between APRA and the ATO

It appears that the advice the Commission received from the regulators was that it is ‘too hard’ to compare the performance of APRA funds against SMSFs. This is disappointing, given the dual regulators are responsible for an industry worth over $2.5 trillion. The competing approaches deliver significant performance reporting differences.

It’s time that the two industry regulators collaborated to deliver accurate insights into like-for-like fund performance.

A full copy of the Class submission can be downloaded here.


Kevin Bungard is CEO of Class Limited, a provider of SMSF administration software.


6 Comments
Robert Hutchings
August 05, 2018

I found this article very enlightening. The CLASS submission is an excellent explanation on the evaluation on S/F performance. I have been tracking the return of our own SMSF against industry find performance (as reported by the Annual Rating reports published in the media) and have long wondered how those funds make allowance for mergers, excess of withdrawals over contributions etc. I am a little suspicious of claims made as there appear to be discrepancies which could be due how these other factors are considered. For example: The recent performance table indicate a top fund having 1,5 and 10 year performances of 12.5, 11.0 and 7.4% respectively (which hopefully are CAGR figures), whilst the same fund was reported the previous year as having performances (over 1,5 and 10 years) of 13.2, 11.8 and 5.8 % respectively . ! cannot reconcile the difference in the 10 year CAGR's with the changes which have simply occured in the latest year included, or the year dropped off.

b0b555
August 02, 2018

@ Fundie, give it another year or so and watch the 10 year returns "magically" look wonderful. I wonder what could have happened around 10 years ago that will soon drop off this calculations.

Alfred Ellis
August 02, 2018

The very high costs charged by Industry and Commercial Funds which lead to SMSFs being established. NOW, the ever increasing costs incurred by SMSFs since the Federal Governments collaborated with their Labor cohorts and introduced changes in 2016. Labor again responding to their UNION MASTERS constant attacks, dictated by their 'self interest' which is to lessen the attractiveness of their main competitors, the SMSFs. This means members of all funds are being sucked dry by all and sundry. The Super System is of not much advantage to those that will end up with an Aged Pension and for those saving to pay themselves a pension they will find themselves 'no better off' than those who have not scrimped and saved, but enjoy their lives with many holidays and not worry about tomorrow! It is just not worth the bother! Pedro the Swift. .

Fundie
August 02, 2018

No wonder everyone complains about data quality. Those return numbers look very low – 4% and 5% returns for 10 years ?!?!? With returns like that - why bother? (institutional super or SMSFs alike) – they are medians of course – but they are woeful.

SMSF Trustee
August 03, 2018

Fundie, over the last 10 years the share market delivered only about 7-8% per annum, so 4-5% for the average of funds that include conservatively invested funds is about right. Certainly far from being 'woeful'!

Mate, it's what the market has delivered. Some 'fundies' seem to believe they can conjure returns that aren't really there and prove their genius, but I don't believe them. 95% or so of the returns I'm looking for in my funds are from the market, not from the genius factor (aka 'alpha').

And as someone else said in a comment on your rant, once the GFC years drop out, the 10 year numbers will improve. Balanced fund trailing average returns will rise to around 8-9% pa.

Cam
August 01, 2018

Great article. A number of organisations, etc at the industry/retail fund level have used the PC report to push for a $1m minimum SMSF balance. The various SMSF bodies should use the facts per this article to promote SMSFs as outperforming larger funds. A media campaign would be great. Also communicating this to Kelly O'Dwyer, and Labor's equivalent.


Leave a Comment:

RELATED ARTICLES

Meg on SMSFs: Ageing and its financial challenges

Are SMSFs getting too much of a free ride?

How to prevent excessive superannuation balances

banner

Most viewed in recent weeks

Which generation had it toughest?

Each generation believes its economic challenges were uniquely tough - but what does the data say? A closer look reveals a more nuanced, complex story behind the generational hardship debate. 

Maybe it’s time to consider taxing the family home

Australia could unlock smarter investment and greater equity by reforming housing tax concessions. Rethinking exemptions on the family home could benefit most Australians, especially renters and owners of modest homes.

100 Aussies: seven charts on who earns, pays, and owns

The Labor government is talking up tax reform to lift Australia’s ailing economic growth. Before any changes are made, it’s important to know who pays tax, who owns assets, and how much people have in their super for retirement.

The best way to get rich and retire early

This goes through the different options including shares, property and business ownership and declares a winner, as well as outlining the mindset needed to earn enough to never have to work again.

A perfect storm for housing affordability in Australia

Everyone has a theory as to why housing in Australia is so expensive. There are a lot of different factors at play, from skewed migration patterns to banking trends and housing's status as a national obsession.

Chinese steel - building a Sydney Harbour Bridge every 10 minutes

China's steel production, equivalent to building one Sydney Harbour Bridge every 10 minutes, has driven Australia's economic growth. With China's slowdown, what does this mean for Australia's economy and investments?

Latest Updates

Economy

Why we should follow Canada and cut migration

An explosion in low-skilled migration to Australia has depressed wages, killed productivity, and cut rental vacancy rates to near decades-lows. It’s time both sides of politics addressed the issue.

Investing

Simple maths says the AI investment boom ends badly

This AI cycle feels less like a revolution and more like a rerun. Just like fibre in 2000, shale in 2014, and cannabis in 2019, the technology or product is real but the capital cycle will be brutal. Investors beware.

Property

Australian house price speculators: What were you thinking?

Australian housing’s 50-year boom was driven by falling rates and rising borrowing power — not rent or yield. With those drivers exhausted, future returns must reconcile with economic fundamentals. Are we ready?

Shares

ASX reporting season: Room for optimism

Despite mixed ASX results, the market has shown surprising resilience. With rate cuts ahead and economic conditions improving, investors should look beyond short-term noise and position for a potential cyclical upswing.

Property

A Bunnings play without the hefty price tag

BWT Trust has moved to bring management in house. Meanwhile, many of the properties it leases to Bunnings have been repriced to materially higher rents. This has removed two of the key 'snags' holding back the stock.

Investment strategies

Replacing bank hybrids with something similar

With APRA phasing out bank hybrids from 2027, investors must reassess these complex instruments. A synthetic hybrid strategy may offer similar returns but with greater control and clearer understanding of risks.

Shares

Nvidia's CEO is selling. Here's why Aussie investors should care

The magnitude of founder Jensen Huang’s selldown may seem small, but the signal is hard to ignore. When the person with the clearest insight into the company’s future starts cashing out, it’s worth asking why.

Sponsors

Alliances

© 2025 Morningstar, Inc. All rights reserved.

Disclaimer
The data, research and opinions provided here are for information purposes; are not an offer to buy or sell a security; and are not warranted to be correct, complete or accurate. Morningstar, its affiliates, and third-party content providers are not responsible for any investment decisions, damages or losses resulting from, or related to, the data and analyses or their use. To the extent any content is general advice, it has been prepared for clients of Morningstar Australasia Pty Ltd (ABN: 95 090 665 544, AFSL: 240892), without reference to your financial objectives, situation or needs. For more information refer to our Financial Services Guide. You should consider the advice in light of these matters and if applicable, the relevant Product Disclosure Statement before making any decision to invest. Past performance does not necessarily indicate a financial product’s future performance. To obtain advice tailored to your situation, contact a professional financial adviser. Articles are current as at date of publication.
This website contains information and opinions provided by third parties. Inclusion of this information does not necessarily represent Morningstar’s positions, strategies or opinions and should not be considered an endorsement by Morningstar.