It’s official: the world stock market is now as wild as it was during the tech-stock bubble. Since April 2026, we’ve had epic levels of return dispersion. AI excitement is driving extreme price moves, with some large-cap technology stocks up 50% to 100% in a single month. While it’s normal for small-cap stocks to sometimes rise 50% in a month, it’s not normal for the whole market to be meaningfully impacted by extreme winners. The chamber of dispersion has been opened, the beast of volatility has awakened, and the season of chaos is at hand.
Figure 1 shows monthly dispersion for the MSCI All Country World Index (ACWI) since January 1995, defined as the value-weighted cross-sectional standard deviation of monthly returns.[1]
Figure 1: Monthly return dispersion in ACWI
January 1995-May 2026
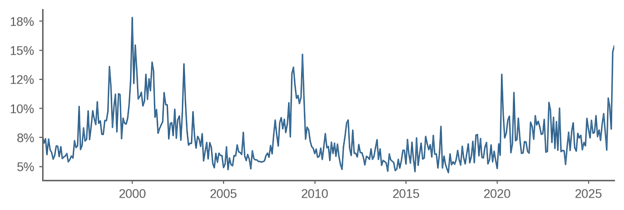
Source: Acadian based on data from MSCI. MSCI data copyright MSCI 2026. All rights reserved. Unpublished. PROPRIETARY TO MSCI. For illustrative purposes only.
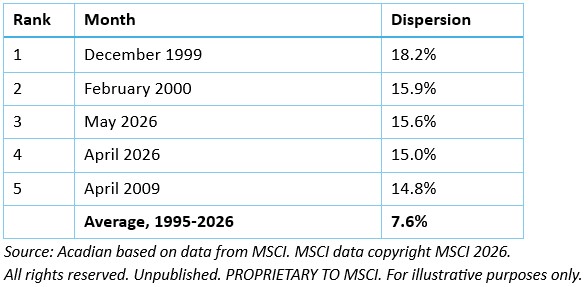
We see high dispersion in the tech-stock bubble as well as during times of market stress. In recent years, dispersion has been modest, but something really changed in April, with dispersion rising to historic levels. Table 1 shows the five highest dispersion months from January 1995 to May 2026. May and April of 2026 were extraordinary, ranking below only December 1999 and February 2000.
Table 1: Top months ranked by dispersion
January 1995 – May 2026 (377 months)
Today’s high value-weighted dispersion does not merely reflect the market’s high concentration into a small number of names. We’ve had high concentration for several years now, but the high dispersion is new.
One framework to understand recent dispersion is via common risk factors generating return covariation, as measured using stock-level characteristics such as country, sector, market beta, and momentum. In April and May 2026, the stocks that went up were U.S./Korean/Taiwanese technology stocks with high beta and high momentum. Thus, one view is that high realized stock dispersion is a byproduct of high realized factor volatility.
An alternative approach is to focus on individual stocks. Since market return is ?wiRi, there are two ways that an individual stock can have a big impact on the market: either by having a big w or a big R. Much ink has been spilled on the topic of market concentration; that is, stocks with a big w. But today we see a different phenomenon: the market is being impacted by stocks with a huge R but only a modestly big w.
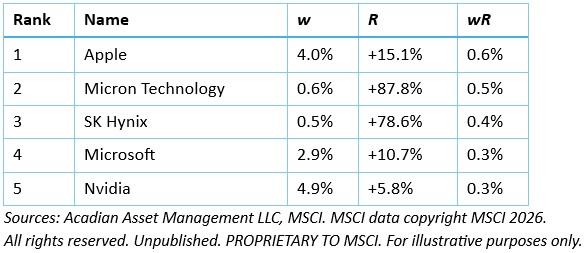
Table 2 shows the top five contributors to market return in May 2026. As you’d expect, the three largest stocks (Nvidia, Apple, and Microsoft) are on the list.[2] But also on the list are Micron and SK Hynix, both with beginning-of-month weights less than 1% but giant returns during the month. Of the total return of 5.2% for ACWI in May 2026, 0.9% came from Micron and SK Hynix; they generated 17% of the market’s return while having only 1.1% of market weight.
Table 2: Largest stock-level contributions to ACWI returns—May 2026
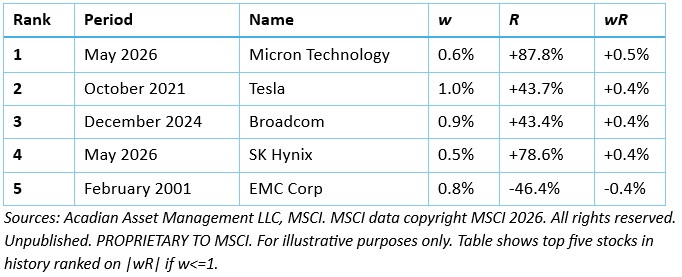
May 2026 was very unusual. Table 3 shows the five largest individual stock contributions to index returns (|wR|) over all history for stocks with weights less than 1%. Of the more than 800,000 stock-month observations, Micron and SK Hynix in May 2026 rank first and fourth.
Table 3: Largest stock-level contributions to ACWI returns—all months since 1995, stocks with weights <= 1%
Based on absolute value of the contributions (i.e., stocks with either positive or negative returns)
What are the implications? First, let’s talk about bubbles. Back in March 2024, I said there was “no bubble yet” because dispersion was low:
Shiller (2005) describes the “gambler’s excitement” of bubbles, and you can’t have excitement unless prices are going up and down … Another aspect of bubble-related volatility is price dispersion, that is, some assets go up more than others. What happened in the U.S. in 2000 and 2021 was not that all assets went up, it was rather that some specific types of assets went up a lot, so that the return gap between winners and losers widened.
Well, dispersion isn’t low anymore. While dispersion is only a minor bubble symptom (I don’t include it in my Four Horseman of the Bubble Apocalypse), anytime you see the latest data looking a lot like 1999/2000, you’ve got to be concerned.
Next, consider the implications for active managers. On the one hand, you’d think dispersion would create opportunities to outperform. On the other hand, risk has gone up; if you’re a long-only manager benchmarked to ACWI and you didn’t hold Micron and SK Hynix in May 2026, you just underperformed your benchmark by 0.9%.
One possible implication of high dispersion is a change in asset manager behavior. According to Petajisto (2013):[3]
When dispersion increases, some managers reduce their active positions … because those positions just became more risky and the only way to prevent tracking error from increasing is to scale back active positions, but that action, in turn, pushes prices further away from fundamentals.
The concern is that we have a squeeze-like dynamic where chip stocks go up, which causes active managers who are underweight to buy them, which causes them to rise further.
It’s an open question whether recent dispersion reflects prices deviating from or converging to fundamentals. Dispersion was very high in December 1999 when many technology stocks soared. In hindsight, this dispersion was a deviation from fundamental value, and it eventually reversed when the bubble deflated. However, there’s no law of finance that says high dispersion produces reversals. An extreme case of one-day dispersion occurred on the announcement of a COVID vaccine on November 9, 2020 (‘vaccine Monday’); Netflix and other ‘stay-at-home’ stocks went down, Walt Disney and other reopening stocks went up. In the subsequent months, these moves were not reversed but instead continued. If the current dispersion comes from 1999-style speculation, we’d expect reversals; if it comes from 2020-style fundamental shocks, we’d expect continuations.
How long will the current market environment last? The high dispersion of December 1999 was followed by subsequent months of high dispersion as the market peaked in 2000 and then fell through 2001. So far in June 2026, we’ve continued to experience high daily return dispersion. The CBOE S&P 500 Dispersion Index, which is based on forward-looking options prices, is currently near all-time highs, indicating that value-weighted dispersion is expected to be elevated over the next month.
One thing’s for sure: high return dispersion tends to amplify performance dispersion across many dimensions including across different asset managers, across different strategies run by the same manager, and across different accounts run by the same manager using the same strategy. Whether today’s dispersion proves to be a bubble symptom, a rational repricing of AI fundamentals, or some unstable mixture of both, it’s a challenge that every market participant must confront.
Endnotes
[1] Value-weighted return dispersion in month t is: 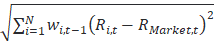 where w is the stock’s cap weight at the end of the prior month. Cross-sectional dispersion of stocks in the index is not the same as time-series volatility of index returns. While dispersion and market-wide volatility are positively correlated over time as an empirical matter, it is logically possible to have high dispersion even when the whole market is flat.
[2] References to this and other companies should not be interpreted as recommendations to buy or sell specific securities. Acadian and/or the author of this post may hold positions in one or more securities associated with these companies.
[3] Petajisto, Antti. "Active share and mutual fund performance." Financial Analysts Journal 69, no. 4 (2013): 73-93.
Owen A. Lamont, Ph.D. is Senior Vice President, Portfolio Manager, Research at Acadian Asset Management. Acadian Asset Management (Australia) Limited (ABN 41 114 200 127) is the holder of Australian financial services license number 291872 ("AFSL"). This article is for informational purposes only. It must not be construed as investment or financial product advice. Acadian has not considered any reader's financial situation, objective or needs in providing the relevant information. The value of investments may fall as well as rise and you may not get back your original investment. Past performance is not necessarily a guide to future performance or returns.