This is an update on my 6 Feb 2026 article on the RBA’s record on inflation.
Australian CPI inflation came in at 3.8% for the 12 months to June 2026. This is down from 4.6% in March, but still well above the RBA’s medium-term target range of 2-3%. The RBA’s preferred measure, ‘trimmed mean’ CPI, is also still well above target at 3.6%.
Despite inflation remaining too high, real rates are still too low, and Federal & State governments continuing on unconstrained inflationary deficit spending sprees, the RBA is reluctant to raise rates further, fearing the government will once again neutralise the rate hikes with even more ‘cost of living’ handouts and productivity-free wage rises which entrench the inflation spiral.
Has this tarnished the RBA’s long-term record on inflation targeting?
Since the RBA gained ‘independence’ in pursuing its 2%-3% target, inflation has only been in the target range just 31% of quarters, and just 36% of calendar years. It has missed its target TWO THIRDS of the time – so the RBA scores just 3 out of 10 for short-term inflation outcomes.
But it was never a short-term target. Overall inflation over the period has averaged 2.6% pa which is in the MIDDLE of its target range – so the RBA has been successful on long-term inflation targeting.
Measured by decade, inflation has been WITHIN its target range EACH decade. Inflation averaged 2.3% pa in the 1990s, 2.8% pa in the 2000s, and 2.1% pa in the 2010s. In the 2020s inflation has averaged 3.5% pa so far, but the decade is not over yet. Inflation over the past 10 years has averaged 3.1%, which is almost within target range.
So, through a host of major global and local crises over the past 30+ years, and despite some policy mis-steps along the way, the RBA has actually ACHIEVED its inflation target rather successfully.
However, I have two further important policy questions:
(1) Why the RBA has the highest/loosest monetary policy target in the developed world? and
(2) Why does the RBA, and all other central banks, target positive inflation at all?
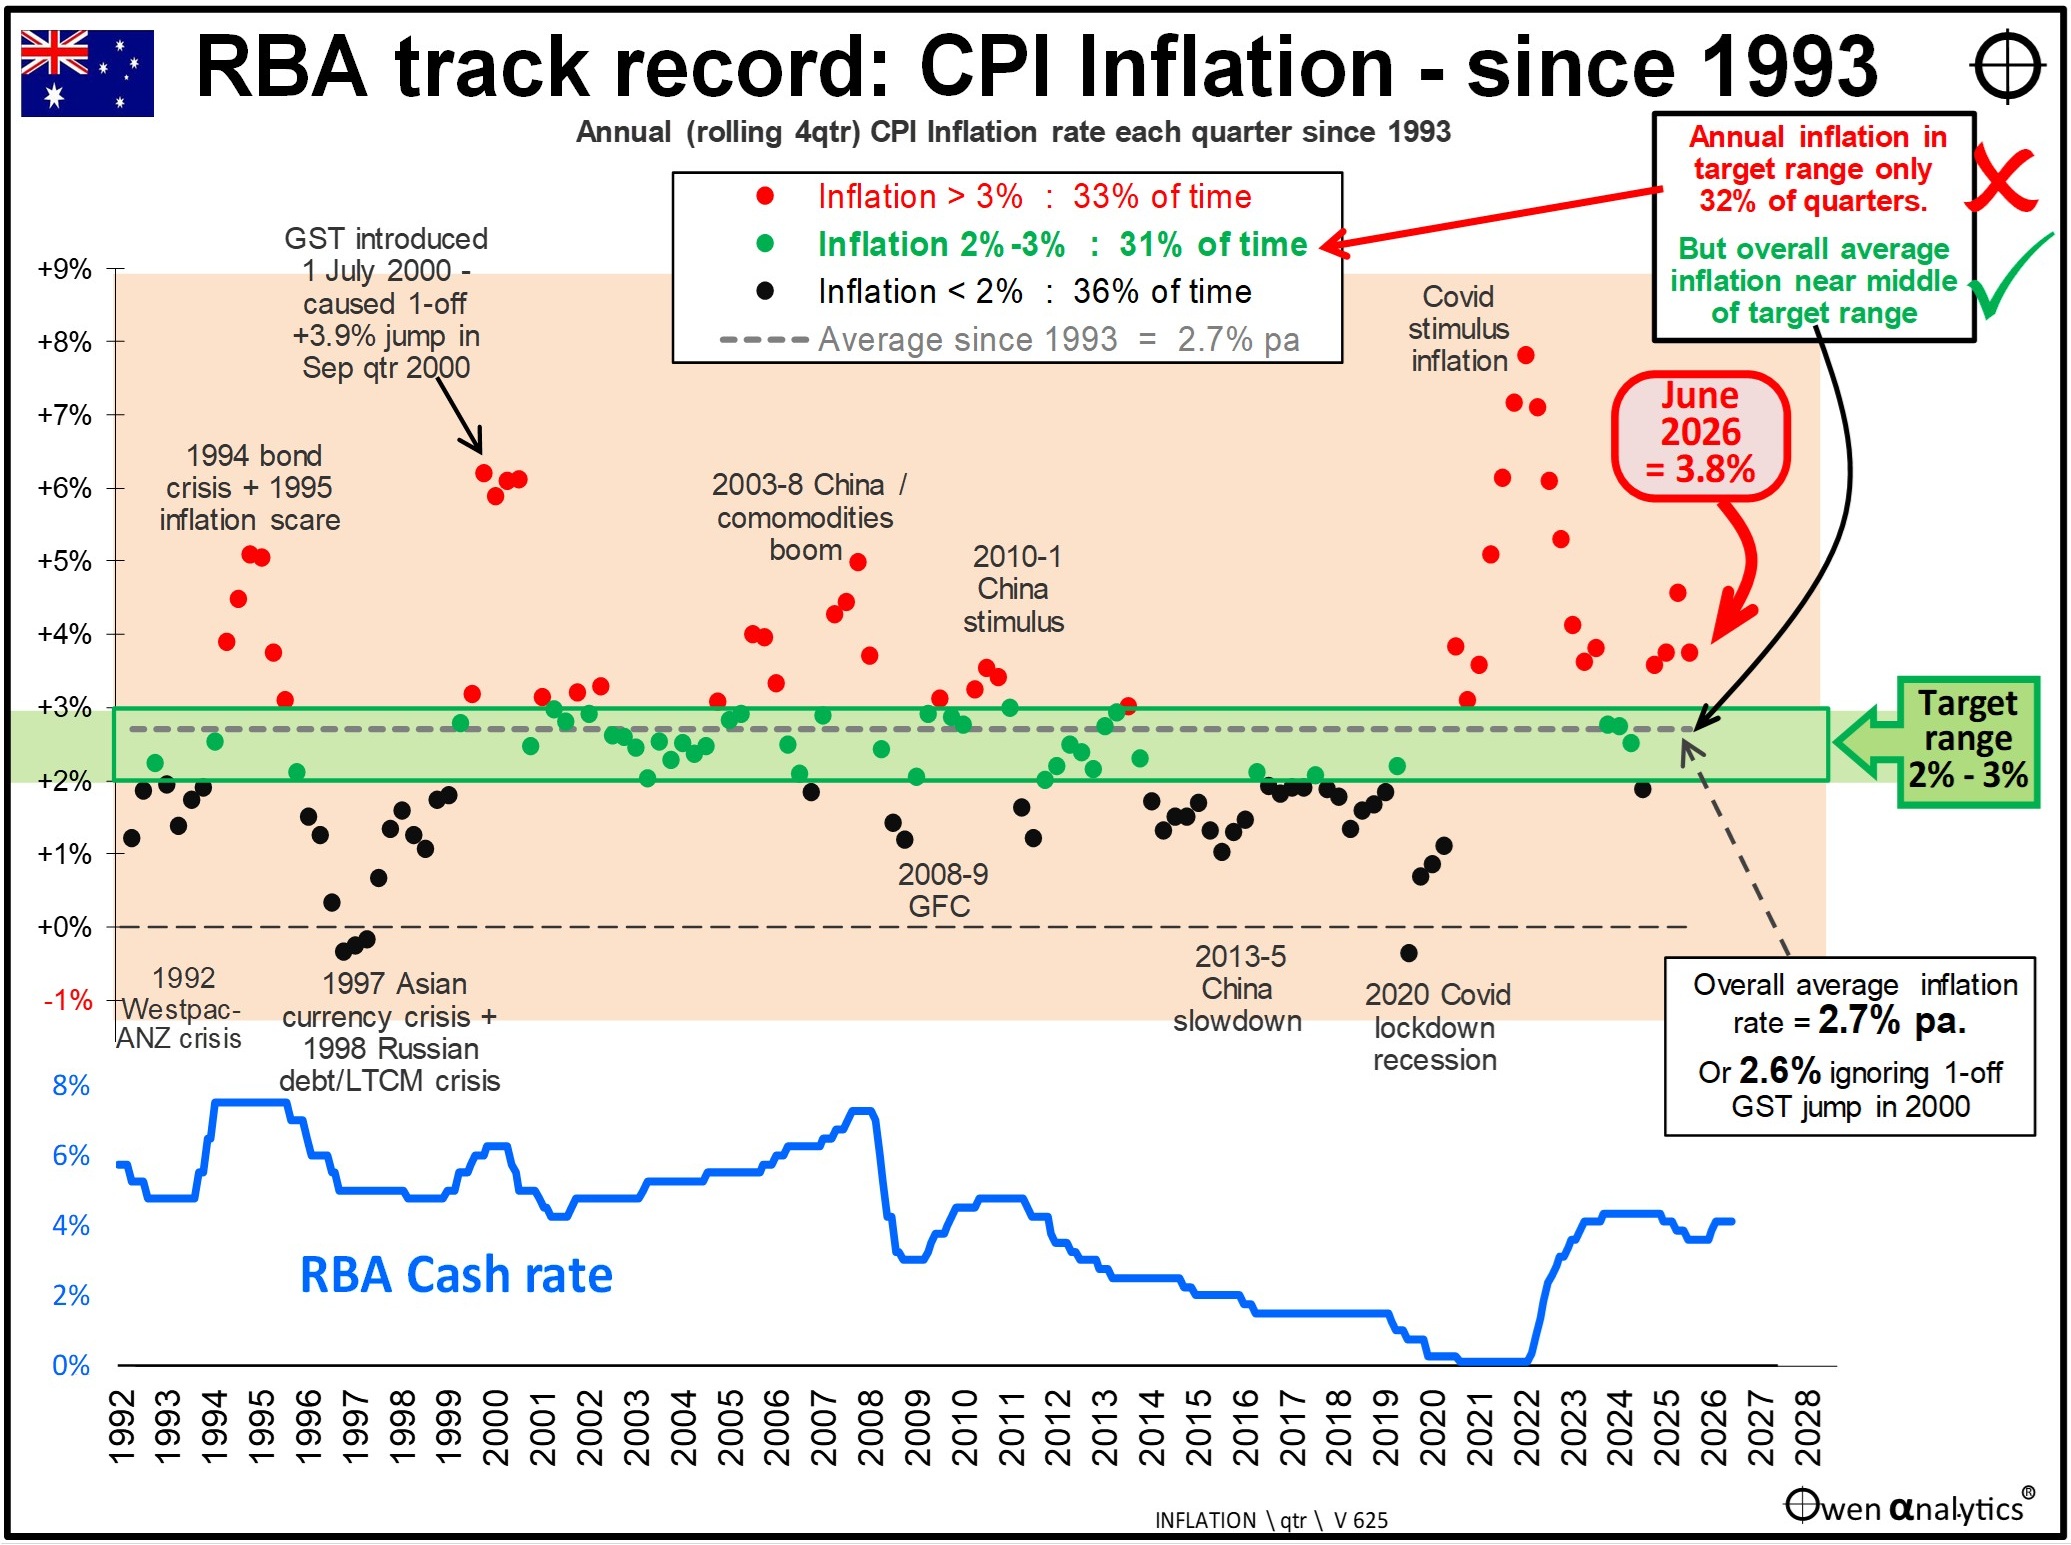
This chart shows the inflation and policy cash rate picture in Australia from 1993. The dots in the upper section represent annual (rolling four-quarter) CPI inflation each quarter (as quarterly has been the main reporting interval for inflation in Australia).
Click to enlarge
- Red dots for inflation above 3%; black dots for inflation below 2%; and green dots for inflation within target 2% to 3% range.
- Inflation has ranged widely from a high of 7.8% in December 2022 (Covid stimulus boom) to several quarters of negative inflation during the 1997 Asian currency crisis, 1998 Russian debt crisis, as well as 2020 Covid lockdown recession.
- The green 2-3% target inflation range through the middle of the spray of inflation dots scattered by a host of global and local macro shocks illustrates how tough it has been to hit a narrow target range.
- The lower section of the chart shows the RBA’s policy cash rate over the period.
- One adjustment - for GST introduction. Just one mechanical note. The 10% Goods and Services Tax was introduced from 1 July 2000 caused a one-off +3.9% jump in the general price index in the September quarter 2000. It also affected the rolling four-quarter annual inflation rates in the subsequent three quarters. We can see these four quarterly red dots in 2000-1 on the chart. A step change in the general price index due to a one-off tax change is not ‘inflation’, so I adjust for this in measuring average inflation rates.
How has the RBA done?
Taken from 1993 as the start of RBA targeting a 2-3% inflation range with substantive policy and operational independence (although you could use 1994 or 1995 or 1996 with the same results), and adjusting for the one-off GST impact in 2000 (as it was not ‘inflation’ but a one-off tax change) we get the following inflation results for the RBA:
Annual inflation outcomes per quarter and per year
Annual (ie rolling four-quarter) inflation has only been within the 2-3% target range just 31% of quarters, and just 36% of calendar years. So the RBA scores just 3 out of 10 for short-term inflation targeting. A quick look at the chart shows only around one third of the dots are in the target (green) range.
However, that is actually not bad given the enormity and impacts of the global macro challenges faced by central bankers over the past 30+years.
Decade averages
Quarterly and yearly inflation measures are rather harsh tests given the volatile nature of inflation components and the data lags involved - from measurement, reporting, decisions, and impacts.
Therefore if we view inflation outcomes decade by decade, inflation has been within the target range each decade:
- Inflation averaged 2.3% pa in the 1990s,
- 2.8% pa in the 2000s,
- 2.1% pa in the 2010s.
- So far in the 2020s inflation has averaged 3.8% pa to date. This above target but we have some years left to run for this decade, so it is too early to call.
- However, for the 10 years to December 2025, inflation averaged 3.1%, which is just inside the target range.
- Therefore the RBA gets full marks on decade average inflation outcomes.
Overall inflation experience
Overall inflation over the whole period has averaged 2.6% per year (or 2.7% pa if you don’t adjust for the one-off GST jump in 2000). This is in the middle of target inflation range – so the RBA scores 10 out of 10 for long-term inflation targeting.
Further thoughts
I have concluded that the RBA has done a pretty good job in achieving its mandated inflation target. Overall at least 8 out of 10. However, I do not agree with the RBA’s inflation goal. (Government sets the goal, not the RBA.)
There are two serious questions I will leave for another day:
The first is why RBA has been given the highest inflation target (ie loosest monetary policy target) in the developed world?
For example, from Federation up until inflation targeting in the 1990s, Australian inflation averaged 1% higher than the US (4% pa in Australia versus 3% pa in the US), for a variety of structural reasons, including our unique system of centralised wage fixing, which was a problem pointed out by Keynes in 1936 and still a problem today (Keynes, ‘General Theory of Employment, Interest and Money’, London, Macmillan, 1936. pp. 267-9 in my 1973 edition).
Now, with specific inflation targeting regimes in place, the RBA’s target is still higher than the US target, which pretty much guarantees Australian inflation will remain higher than the US in future as well (ie looser monetary policy, higher interest rates, and weaker currency).
Is there a valid policy reason for this? I say No.
The second question is why the RBA and other central banks aim for positive inflation at all?
With fiat/paper currencies, inflation is government-endorsed theft of the wealth of its citizens. Inflation is the most regressive form of tax imaginable, as its hits low income earners and the poor much more savagely than high income earners and the rich. Inflation is essentially a deliberate and pernicious transfer of wealth from creditors (bank depositors, savers) to debtors (asset owners and especially geared-up asset owners, and governments).
The Reserve Bank Act (initially in 1959 and still now) mandates ‘stability of the currency’ which means stable purchasing power of the currency – ie stable prices. ‘Stable’ prices means ‘flat’ prices, NOT constantly inflating prices, which is deliberate, constant, government-mandated, forever-compounding theft from its citizens.
Is there a valid policy reason for this? I say No, for reasons that go back to Nicholas Oresme, St Thomas Aquinas, and even Aristotle. But that is another story for another day.
Ashley Owen, CFA is Founder and Principal of OwenAnalytics. Ashley is a well-known Australian market commentator with over 40 years’ experience. This article is for general information purposes only and does not consider the circumstances of any individual. You can subscribe to OwenAnalytics Newsletter here.