Graham Hand recently attended the Research Affiliates Advisory Panel conference in California, featuring presentations by many of the world’s leading investment professionals. The innovative paper reviewed here uses ‘stale’ prices to compile a ‘cap-weighted’ portfolio, with surprising results. The full academic paper will be published in the Summer 2015 edition of the Journal of Portfolio Management (JPM). Research Affiliates and JPM gave permission for this summary to be released in advance of the full paper.
There’s no doubting the spectacular success of ‘passive’ investing based on the market capitalisation weights of companies. It is estimated that almost 20% of all managed fund assets are based on cap-weighted indexes, up from less than 9% in 1998. It is based on the theory that in an efficient market where equity prices reflect all known information about a company, there is no capacity for a talented analyst to outperform, and a portfolio that uses the most up-to-date prices should deliver the best results. On the other hand, even if the market is not efficient, then surely the active manager with the timeliest information has the best chance to outperform (ie, deliver ‘alpha’).
Researchers at the California-based index and asset allocation specialists, Research Affiliates, have tested another theory, which they call the ‘Rip Van Winkle’ approach. The story goes that the idle Rip Van Winkle fell asleep for 20 years after a drinking session, and he woke to a vastly different world. What if we did this with a cap-weighted investment portfolio by discarding 20 years of market data?
The table shows the market cap of the Top 10 companies in the United States over the last 20 years at five-year intervals, and the changes have been dramatic. There are companies in every Top 10, such as General Electric (from 4.1% of the index down to 1.5%), Exxon (from 3.6% to 2.3%) and Wal Mart (from 2.6% to 1.3%). Most have dropped out of the Top 10 over the years, while Apple and Google were nowhere even five years ago.
List of Top 10 stocks in the US at current time plus 5, 10 and 20 years ago (Jan 2014)
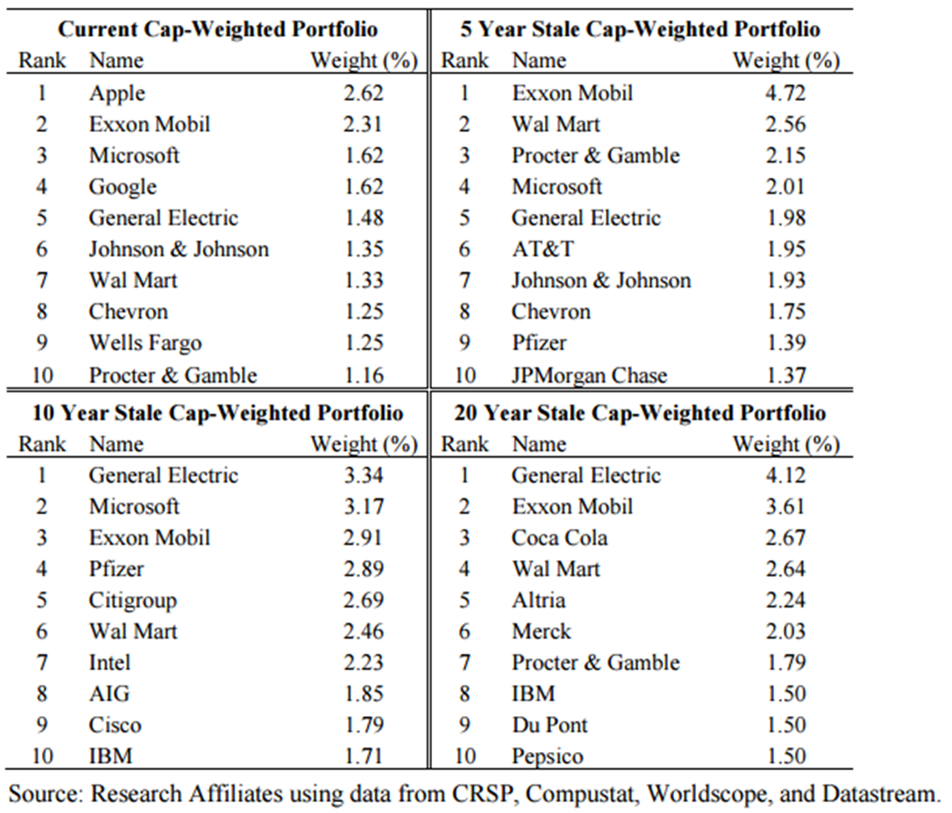
GH Table1 290515
How are the performance numbers calculated?
Research Affiliates assumes Rip Van Winkle wakes up and constructs a portfolio reusing the cap weights of the 1,000 largest stocks from when he fell asleep 20 years earlier. He ignores stocks that no longer exist and invests their weight in remaining companies in proportion to their old capitalisations. In subsequent years, he then rebalances back to the stale weights 20 years earlier. For example, since the reliable data starts in 1926, the analysis waits until 1946 to use the 20-year-old cap-weighting data. This gives results over the past 67 years (1946-2013) for a portfolio always weighted back to 20 years ago.
The method produced a risk-adjusted outperformance of 1.8% per annum over the normal cap-weighted index, which would have placed Rip near the top of active managers.
What’s happening? Research Affiliates argues alpha is added by severing the link between the weight of a company in the portfolio and its price. It’s the same argument they make for fundamental indexing, where stocks are weighted according to their economic footprint. Using cap-weights, the more expensive a stock becomes, the heavier its weight in a portfolio, and similarly, the cheaper the stock, the less its weight. Almost anything that breaks this link will outperform, based on the known empirical factors of value and mean reversion.
As with any strategy that deviates from the usual cap-weighted index, there are long periods of disappointment in the results before the market ‘corrects’ itself. Indeed, the results were almost flat for the first 20 years, and then kicked in over the last 47 years, when the incremental returns were almost 3% per annum. This is a lesson in not jumping out of a strategy in the short-term, or leaping on to the latest fad.
The final results are spectacular, with 1.8% per annum compounded from 1947 to 2013 producing nearly three times the value of a cap-weighted portfolio over this time period. Rip’s strategy ignored the tech bubble and wreck of the late 1990s and allocated to financials just like any other year during the GFC. This obliviousness to fears and fads turns into an advantage in following years, especially since the stock values of yesteryear did not carry such valuation excesses.
Investment characteristics of the Rip Van Winkle portfolio
The longer the numbers were lagged in the analysis, the better the results. The longer-lagged indexes were less biased towards today’s most expensive stocks. By severing the link between the price of a stock and its weight in the portfolio, value is added … even when using cap-weights!
The factors leading to the outperformance include a small-cap tilt, due to overweighting companies which are smaller relative to their cap-weights at the end of the measurement period. And there is a value tilt, an anti-momentum bias and of course long-term mean-reversion, all at the economically significant level. But this factor attribution explains only about half the residual alpha, so there is some priced factor missing from the explanation. The analysts invite the finance community to join the hunt.
Some of the great benefits of cap-weighting are the high capacity, strong liquidity and low turnover of a portfolio. Of course, these also apply for Rip’s portfolio. Large companies tend to stay large for many years, and the portfolios both have hundreds of familiar names, with weights that have broad representation in the economy even 67 years later.
Cap-weight portfolios have low turnover because they rebalance automatically. In this analysis, Rip rebalances every year, but turnover is surprisingly not much larger, and significantly less than most active managers.
Sleep on it
The ‘active versus passive’ investing debate has raged for decades. One side argues the cap-weighted index cannot be consistently outperformed and is an optimal portfolio. The other side believes talented active managers with superior analysis and better information can deliver alpha. Both sides accept to differing degrees that opportunities are arbitraged away by competition in the market.
Then along comes Rip Van Winkle, who could not be bothered changing his portfolio weightings for 1,000 companies after he fell asleep for 20 years. He uses the same approach in global equities, including emerging markets, and then repeats the exercise over 67 years of data. It’s not ‘value versus growth’ or ‘active versus passive’. It’s market cap indexing versus market cap indexing with a lag.
Research Affiliates is not arguing that Rip has hit on a great new investing strategy, as there are better choices available. Rather, they explore a crazy idea to support their long-established argument on the benefits of breaking the link between the stocks in a portfolio and their current market price.
And any active manager who could deliver outperformance of almost 2% per annum for a long time would sleep easy on the result and dream of the dollars rolling in.
The authors of the research are Robert Arnott, Noah Beck and Vitali Kalesnik of Research Affiliates.
Graham Hand is Editor of Cuffelinks and was a guest at the Research Affiliates Advisory Panel. This article is for information purposes only and does not constitute investment advice, nor an opinion on the appropriateness of any investment. Research Affiliates, LLC does not warrant the accuracy of the information provided herein, either expressed or implied, for any particular purpose.