Following large positive returns in 2008, managed futures (or Commodity Trading Advisers (CTAs)) funds such as those offered by Aspect Capital, Man and Winton received increased allocations from institutional and retail investors. However, subsequent performance has been below its long-term average. From January 2009 to June 2013, the annualised return of the Newedge Trend Index was -0.8%, compared to 8.0% over the prior five-year period, while managed futures assets under management have grown from US$206 billion to US$331 billion, according to BarclayHedge estimates.
Understandably, investors in CTAs have begun to question performance. Have markets changed after the 2008 financial crisis? Will these types of strategies ever work again?
In a discussion paper using almost a century of data, we investigate what typically happens to the performance of the core trend-following strategy pursued by managed futures following major global financial crises, and ask is what has happened post-2008 typical of what happens after a financial crisis?
If yes, then what happens to price patterns in the futures markets traded by CTAs to cause this under performance during such turbulent periods?
Methodology
A global portfolio was simulated to analyse the performance of trend-following during six of the largest global crises in the last century: the Great Depression in 1929, the 1973 Oil Crisis, the Third World Debt crisis of 1981, the Crash of October 1987, the bursting of the Dotcom bubble in 2000, and the sub-prime/Euro crisis beginning in 2007.
The start date for each crisis was defined as the month following the equity market high preceding the crisis. Rather than try to define the end of the crisis, ‘crisis periods’ were considered over two fixed time periods, 24 months and 48 months. All data outside of these periods were considered ‘non-crisis’ periods.
The data set consisted of 21 commodities, 13 government bonds, 21 equity indices, and currency crosses derived from nine underlying exchange rates covering a sample period from January 1921 to June 2013. Transaction costs were included in the calculation of portfolio performance, based on asset classes traded and time periods. Management and incentive fees of 2% and 20% were applied.
The trend-following portfolio was constructed using momentum signals made up of multiple time periods, averaged to create a momentum signal for each instrument. Each asset class was given an equal risk weighting. Equal risk was also allocated to each instrument within each asset class.
Results
Net of fees, the portfolio delivered an average annual excess return (i.e. excluding the cash return) between 1925 and 2013 of 12.1%, with an impressive Sharpe ratio of 1.1 and volatility of 11.0%. Between 2000 and 2013 the portfolio, net of fees and costs but including a cash return, had a 0.76 correlation to the Newedge Trend Index.
Looking at performance in crisis and non-crisis periods, across the full sample period from 1925 to 2013, the results are very consistent, as shown in Panel A.
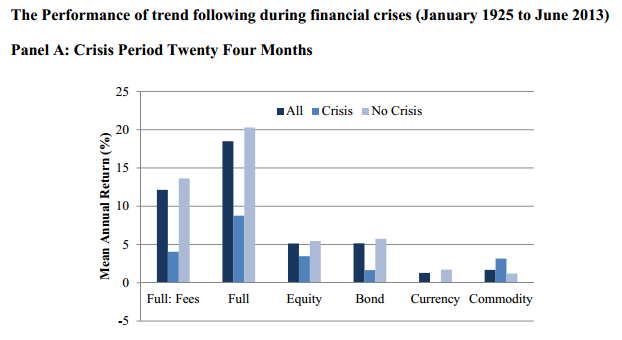
At the full portfolio level the average annualised return in the first 24 months of a crisis is 4%, compared to 13.6% in the non-crisis months. The Sharpe ratio also falls by 0.88 to 0.36. The return in the four-year period from the start of a crisis averages 6%, compared to 14.9% in the non-crisis sample. Here the Sharpe ratio falls from 0.80 to 0.55.
Across asset classes, the results for equity indices, government bonds, and currencies over the four-year crisis periods are all consistent, with the drop in Sharpe ratio ranging from 0.19 to 0.71. Consistent with prior evidence on the lack of synchrony between the cycle of commodities and financial asset classes, commodities generate similar returns in both crisis and non-crisis periods.
For a two-year crisis period the full portfolio net of fees generates positive returns which are almost one third of those earned in non-crisis periods.
The only exception is currencies which performs worse in the two years following a crisis, but after four years performs in line with non-crisis returns.
A comparison of crises
The heterogeneous nature of global crises makes them difficult to compare. However a number of features can be highlighted.
The crises can be loosely classified into two groups, those that develop quite rapidly, 1929, 1987 and 2000, and those that develop more gradually, 1973, 1981 and 2007.
Those in the first group tend to start with a period of very poor trend-following performance, generally due to losses in the equity index sub-portfolio, as the indices reverse quite sharply. Those crises which develop more slowly allow time for the trend-following signals to adjust to the new market direction before the crisis fully develops, resulting in short run profitability.
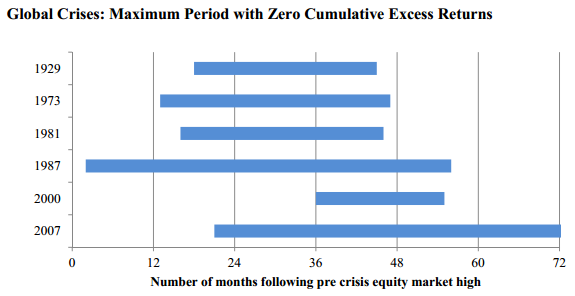
The poor performance following global crises is generally due to extended periods where cumulative returns move sideways rather than experiencing significant drawdowns. These periods are characteristic of all the crises examined. The maximum period in each crisis where a new investor would generate zero excess return (net of cash) ranges from 18 months (2000) to 54 months (1987) and averages three years.
It is notable that this extended period of weak performance begins at different intervals in the crises and is of varying duration.
Why returns vary so much
Our analysis of the long term performance of trend-following strategies using a diversified global multiple asset class portfolio from 1925 to 2013 suggests that the strategies have produced consistently high returns through time. These strategies typically underperform for an extended period, of varying magnitude and duration, following a crisis.
This should give investors employing these types of strategies some comfort. Despite the below average recent performance of trend-following managed futures, this performance is consistent with comparable historical periods. Each of these periods has ended and the strategy has gone on to generate returns closer to the long-term average.
We find significant differences in the time series dynamics of the underlying markets between crisis and non-crisis periods. In futures markets there are strong autocorrelations in time series returns of instruments at lags of one to twelve months, which drive trend-following returns. We find that during periods of financial crisis, this relationship is significantly diminished. This has the consequence of significantly reducing the returns of the trend-following strategy.
What happens to cause this break down in the time series behaviour of futures markets following a major financial crisis?
Existing behavioural finance theories provide some predictions which our results support. For example serial correlation in asset returns has been linked to increases in overconfidence and decreased risk aversion of investors. Precisely the opposite conditions occur following a financial crisis with investor confidence falling and increasing risk aversion. Under both models, opportunities for generating trend-following returns should decrease in these periods.
Also, governments have an increased tendency to intervene in financial markets during crises, resulting in discontinuities in price patterns. The Federal Reserve’s support of Bear Sterns in March 2008 and the intervention by the Hong Kong Monetary Authority in Hang Seng futures in 1998 both caused sharp reversals in their respective markets. The frequency, effect and consequences of these interventions for trend-following requires further research.
Finally, hedging pressure has long been recognised as having a role in the price setting mechanism of commodity markets. Changing dynamics in hedging pressure during crises may cause changes in market characteristics. More explicitly, the returns of trend-following have been linked with the cost of hedging, as speculators (trend-followers) capture a premium from hedgers. It is possible that, as hedgers benefit from positions in a crisis, the premia normally paid by hedgers to speculators is reversed.
To read the full discussion paper, featuring detailed methodology, results and analysis, including evidence from regional crises, visit http://ssrn.com/abstract=2375733
Professor Mark C. Hutchinson and John J. O'Brien are from the Department of Accounting, Finance & Information Systems and Centre for Investment Research at University College, Cork, Ireland. Aspect Capital provided financial support for the study. This article is general in nature and readers should seek their own professional advice before making any financial decisions.