Register For Our Mailing List

Register to receive our free weekly newsletter including editorials.

Home / 568

This vital yet "forgotten" indicator of inflation holds good news

Reducing inflation to an acceptable rate is an important policy priority. Although much progress has been made over the past couple of years, the goal has not yet been achieved. We are close and the trend is in the right direction, but some of the hysterical headlines that followed the May monthly CPI release would have us believe that inflation is re-accelerating and requires higher interest rates.

To be sure there’s a chance that the Reserve Bank of Australia (RBA) will see it that way, especially if the June monthly and quarterly CPI data don’t unwind some of the recent increases seen in the monthly series. They may consider progress to be too slow and elect to tighten a little further. Personally, I suspect that we will see an easing back because I believe there’s some seasonality to the monthly CPI series in which prices rise above-trend in summer then fall back again through autumn. Not many people realise that the May CPI print – the index, not the rate of change – was actually lower than the April level, which is a bit of a pattern at this time of year since the monthly series kicked off 7 years ago. Plug in monthly increases of 0.3% (equals 3.6% per annum) over the coming months and the year-to rate will be back down at 3% by September. (That’s not a forecast, by the way, merely a projection to illustrate my point.)

My concern in the discussion of the inflation trend is that a key piece of information is being ignored. This data was widely ignored ahead of the outbreak of inflation in 2021 and continues to be absent from almost every commentary on inflation and monetary policy. This key piece of information is the money supply.

All of us who learned our economics in the 1970s knew the aphorism that “inflation is always and everywhere a monetary phenomenon.” That phrase, uttered by the famous Chicago economist Milton Friedman almost 70 years ago, has been discarded in recent decades, which I think is a shame. Although there are some good reasons for the move away from simplistic monetarism, the fact that the link between money supply growth and inflation has been largely forgotten goes a long way towards explaining the mess we’ve been in for the past few years.

Let me explain what I mean. It starts with an economic identity that may or may not be familiar to you.

MV = PT

You don't have to be a Friedmanite quantity theorist to find analytical usefulness in the identity that states that the nominal value of goods and services produced in the economy (P, for prices, times T for real value of transactions) is equal to the amount of money (M) in circulation and how rapidly it circulates (V, for velocity).

Nor do you have to believe in a simplistic causal relationship between money supply growth (M) and inflation (P) to accept that there is, nonetheless, a key relationship between the two. And, therefore, that if the growth of M changes markedly then there is a likelihood that the growth rate of P will change in the same direction.

A related saying is that inflation results from “too much money chasing too few goods”. When we have just the right amount of steady money supply growth in the context of steady real output growth, then we’ll have steady inflation. When there’s excessive money supply growth, beyond the capacity of the real economy to keep up, then the macroeconomic outlet is rapidly rising prices for goods and services – aka inflation. And when money supply growth is too tightly restricted, then inflation is driven down by recessionary tendencies in the real economy.

Monetary policy, therefore, has a great deal to say about the inflation rate that the economy will experience. That’s why much of the task of preventing excessive inflation and bringing it back under control if it gets away, falls to the RBA.

The following chart shows the relationship between money growth (M) and inflation (P) over time in Australia. Here, I take the broadest definition of money that the statistics can give me, which in Australia is called ‘broad money’. The chart (sourced from the RBA and ABS) shows how its growth has behaved over the years and how inflation has behaved at the same time.

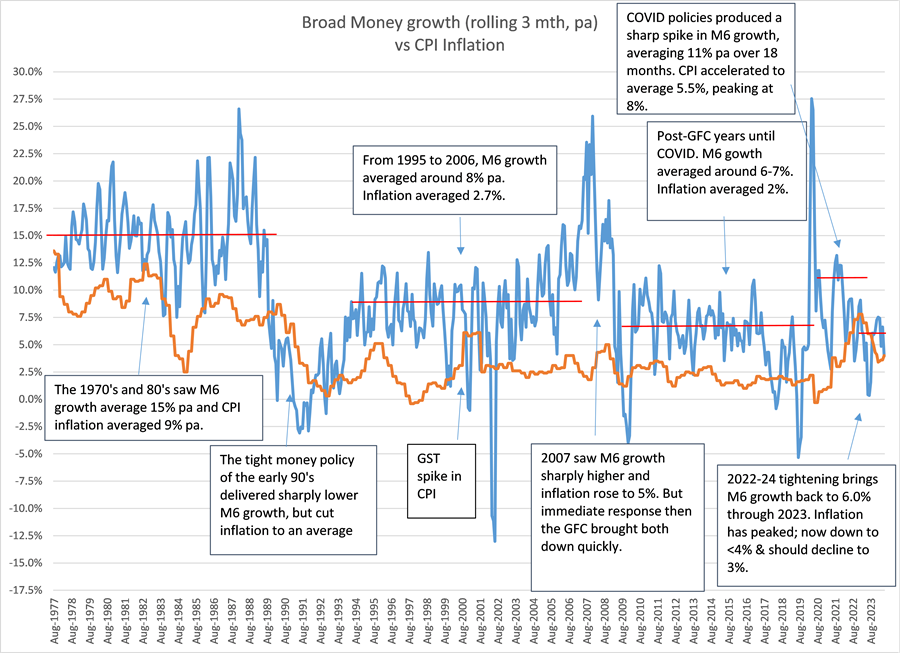
The notes within the chart address the various phases of the last 45 years, but basically the relationship is that broad money growth equals inflation plus a margin, with the margin holding quite steady for prolonged periods of time. Much of that margin is the growth of T in the MV = PT identity, that is the rate of real economic growth, which has varied between around 2-3% in different periods. The rest (another 1-2%) captures a range of factors, including a trend decline in the velocity of money and a factor that monetary economists call ‘financialisation’ or the growth in the ratio of financial wealth to national income as the asset base of the economy grows in value.

In my opinion, the sharp increase in Australia’s inflation rate in 2022 was both caused by and was predictable because of the surge in money supply growth during 2020. Readers of Firstlinks were warned of this as early as April 2020 in an article by Prof Tim Congdon, Magic money printing and the reality of inflation. Soon after, broad money growth in Australia accelerated to almost 20%, so it came as no surprise to me that inflation rose to 8% soon after.

But it did surprise most analysts. Then when the inflationary outbreak was finally recognised, the majority rushed to lay the blame at the feet of a host of individual issues, in particular supply constraints in some markets because of the pandemic and the impact on oil prices of the Russian invasion of Ukraine. Those factors were definitely at work – they contributed to the ‘too few goods’ part of the story – but in my view can only become widespread inflation if allowed to by ‘too much money’ chasing the goods and services being produced and supplied.

In any case, the focus on supply-side issues led to a widespread questioning of the RBA’s policy response of increasing the cash rate to tighten monetary conditions. My view, however, is that they were too slow to do this. The time to respond to bring the growth in the economy and the money supply back to more acceptable levels was in early 2021. They had the monetary evidence in front of them by then but ignored it.

That’s history now and to their credit the RBA eventually defied much opposition, lifting the cash rate rapidly from near zero to 4.1% by early 2023, then took it a bit higher in November 2023 to 4.35%. As a result, inflation has fallen from that 8% peak 2 years ago to the 3-4% region now.

What’s the current story with money supply growth? After the 2020 spike, things have settled very well in response to tighter policy. Broad money grew in the 3 months to May at an annualised rate of just under 4%, bringing the year-to May growth rate in at 4.76%. That's the ninth month in the last 12 where the year-to rate of growth has had a 4 in front of it and it now looks more like the trend rate of broad money growth is slowing to less than 6%.

That being the case, the chances of inflation falling back into the RBA's 2-3% medium-term target band are improving – whatever the latest monthly CPI might say! And this in turn means that the current interest rate settings for monetary policy are, to use an old RBA word, 'appropriate'.

There may yet be some bumps along the way as Australia is navigated towards a lower and more stable inflation rate once again. I’m pleased that this outcome is universally regarded as a desirable one. Inflation is also always and everywhere a pernicious outcome that has negative consequences for both the efficiency and fairness of the way our economy performs. The RBA was right to begin focusing on it 30 years ago and, whatever they choose to do with interest rates at their next few meetings, they’ll be right to continue to focus on it now.

From an investor’s point of view, I believe this means that the building blocks of asset pricing calculations can now start with an inflation rate assumption of 2.5-3.0%; a neutral cash rate of 3.75-4.0%; and a long bond rate of 4 – 4.5%. As I said, those levels might not be achieved immediately, but at this stage that’s where things seem to me to be trending.


Warren Bird has over 40 years’ experience in public service, business leadership and investment management. He is currently a Director of the WA Government Employees Super Board (GESB) and Chair GESB’s Investment Committee. He is also Chair of the independent Audit and Risk Committee of the Illawarra Shoalhaven Local Health District. This article reflects the personal views of the author.


11 Comments
Warren Bird
July 31, 2024

For those interested, as well as the latest CPI data, today (July 31) saw the latest money supply data released. Here's what I said on LinkedIn about the updated story of money and inflation:

Today's data for inflation has made all the headlines, with good summaries easily available so I won't say much. Just that in my view Australia remains on track for a continued decline in CPI inflation to the RBA's preferred range.
I say this largely because also released today are the monetary aggregates data. Broad money (aka M6) was pedestrian in the June quarter, growing at an annual rate of only 3.5%. To be sure, this is a bit faster than in the June Qtr last year, so the year-to rate of increase ticked up, but only to 5.4% which is still well within the sort of growth rate range that's consistent with inflation of 2-3% rather than staying around 4%.
Whatever happened to prices in the June Quarter 2024 was a lagged reflection of the stance of monetary policy well over a year ago, so doesn't yet capture the impacts of the last 150 bps or so of cash rate increase. But money growth is capturing it and is telling the story that enough has been done already to bring inflation back under control. It's possible that the tax cuts and other budget measures will give money growth a kick along, so it's still too early to be thinking about rate cuts, but surely rate increases are off the agenda now!

Tony Dillon
July 16, 2024

Another link often not picked up on when it comes to inflation, but which has been an ongoing concern for the RBA, is productivity growth. It has been low for some time now, and needs to lift if inflation is to decline. Why? Because greater productivity means more goods and services, and at a lower cost per unit. Which increases supply and puts downward pressure on prices therefore lowering inflation.

And one factor suppressing productivity is the cost of energy. The last couple of years have seen energy prices surge far in excess of inflation for various reasons, including global volatility and domestic energy policy decisions. In fact higher energy costs affects inflation in two key ways. Either profit margins are reduced leading to less investment in technology to enhance productivity, or increased costs are passed onto consumers driving up inflation.

At the end of the day, the cost of energy flows through to the cost of everything, from transport, to manufacturing, the services industry, agriculture, you name it. Which just goes to show the importance of maintaining affordable and reliable energy in the transition to a low emissions economy. Otherwise inflation will likely be always under the pump.

John Ovens
July 14, 2024

Broad Money does not include credit card finance, which did not exist in the 1970s as much as it does today. If the formula is adjusted to include credit card finance, it might reveal a different story.

Warren Bird
July 15, 2024

Money supply measures are calculated from cash and deposits, not lending. Although technically its the lending that creates money, as a financial system all lending generates deposits. So credit card finance IS ultimately captured in broad money because the spending that it funds creates deposits. Broad money is, therefore, an appropriate measure to use.

Dean
July 14, 2024

Many years ago in undergraduate Microeconomics, I was taught 10 principles of economics - Principal 9: ‘Prices rise when the government prints too much money.’ I therefore fully anticipated the spike in inflation.

John Bone
July 12, 2024

Gosh, we’re lucky that the current government hasn’t thrown wood on the fire by increasing spending! About that!

Chris Davis
July 13, 2024

Whilst the opposition demand they spend even more to assist cost of living pressures, and then suggest the taxpayers go into hock for tens of billions of dollars to build government owned and run power plants that will provide the most expensive electricity in every country that currently uses it.
There is no monopoly on political hypocrisy and vote buying stupidity.

Ian huntley
July 12, 2024

Excellent discussion Warren....Ian H.l

Geoff D
July 11, 2024

This is why I argue that the Government needs to remove money from the economy by taxing the currently untaxed profits on the sale of residential homes and reducing Government debt.

Untaxed profits lead into higher prices for replacement properties exacerbated even further by the increased mortgages which become available on the increased purchase prices. An ever increasing upward spiral!

Admittedly, one hopes the relevant Government doesn't waste that resource and one can never be sure of that!

George B
July 12, 2024

I would argue that selling and buying a property in the same market does not result in any real profit because taxes and transaction costs (eg.stamp duty, agent's commission) remove at least 8% of the money involved in the transaction.

Dudley
July 11, 2024

"inflation rate assumption of 2.5-3.0%; a neutral cash rate of 3.75-4.0%; and a long bond rate of 4 – 4.5%":

Real net rate middle incomers:
= (1 + 4.5% * (1 - 31.5%)) / (1 + 3%) - 1
= 0.08%
With no premium to cover medium term capital value gyrations.

Real net rate 1 year term deposits for larger incomers:
= (1 + 5.2% * (1 - 47%)) / (1 + 3%) - 1
= -0.24%

Who would sell assets to add their money to the money supply at such small real net rates?

Who would bring more money into existence by mortgaging their incomes and assets?

Onward mortgages and home prices until the angle of repose on the debt mountain threatens a massive uncontrollable debt-slide.


Leave a Comment:


RELATED ARTICLES

Former RBA Governor on why interest rates won't come down soon

CPI may understate the rising costs of retirement

Australia’s economic outlook robust, but risks are rising

banner

Most viewed in recent weeks

An important Foxtel announcement...

News Corp's plans to sell Foxtel are surprising in that streaming assets Kayo, Binge and Hubbl look likely to go with it. This and recent events in the US show the bind that legacy TV businesses find themselves in.

The nuts and bolts of family trusts

There are well over 800,000 family trusts in Australia, controlling more than $3 trillion of assets. Here's a guide on whether a family trust may have a place in your individual investment strategy.

Welcome to Firstlinks Edition 581 with weekend update

A recent industry event made me realise that a 30 year old investing trend could still have serious legs. Could it eventually pose a threat to two of Australia's biggest companies?

  • 10 October 2024

Preserving wealth through generations is hard

How have so many wealthy families through history managed to squander their fortunes? This looks at the lessons from these families and offers several solutions to making and keeping money over the long-term.

The quirks of retirement planning with an age gap

A big age gap can make it harder to find a solution that works for both partners – financially and otherwise. Having a frank conversation about the future, and having it as early as possible, is essential.

Welcome to Firstlinks Edition 578 with weekend update

The number of high-net-worth individuals in Australia has increased by almost 9% over the past year, and they now own $3.3 trillion in investable assets. A new report reveals how the wealthy are investing their money.

  • 19 September 2024

Latest Updates

Investing

Preserving wealth through generations is hard

How have so many wealthy families through history managed to squander their fortunes? This looks at the lessons from these families and offers several solutions to making and keeping money over the long-term.

Planning

The nuts and bolts of family trusts

There are well over 800,000 family trusts in Australia, controlling more than $3 trillion of assets. Here's a guide on whether a family trust may have a place in your individual investment strategy.

Exchange traded products

How ETFs and indexes cope with company delistings

The complexion of a stock market is ever-changing, with companies coming and going. But what happens to indexes, and the ETFs that use them as benchmarks, when a company is removed because of a merger or acquisition?

Infrastructure

The quiet asset class delivering structural growth

Investors remain fixated on stocks exposed to megatrends like AI and digitisation. Another less appreciated asset class offers significant structural growth without the excessive valuations that usually come with it.

Investment strategies

Survive the next crash by learning from the Stoics

Ancient Stoic philosophers had an idea called 'premeditatio malorum', that involves considering some of the worst things that can happen to you as a way of immunising yourself against them. It can be a useful tool for investors too.

Fixed interest

Stars align for fixed income

It isn't too late for investors to own bonds and take advantage of this early stage of the rate-cutting cycle. What's more, bonds are regaining their ability to be a genuine diversifier within portfolios.

Investment strategies

The markets to gain most from US rate cuts

US rate cuts, low starting valuations and an uptick in global capex are just some of the tailwinds behind emerging markets. A value approach can help investors grasp growth opportunities without overstretching.

Sponsors

Alliances

© 2024 Morningstar, Inc. All rights reserved.

Disclaimer
The data, research and opinions provided here are for information purposes; are not an offer to buy or sell a security; and are not warranted to be correct, complete or accurate. Morningstar, its affiliates, and third-party content providers are not responsible for any investment decisions, damages or losses resulting from, or related to, the data and analyses or their use. To the extent any content is general advice, it has been prepared for clients of Morningstar Australasia Pty Ltd (ABN: 95 090 665 544, AFSL: 240892), without reference to your financial objectives, situation or needs. For more information refer to our Financial Services Guide. You should consider the advice in light of these matters and if applicable, the relevant Product Disclosure Statement before making any decision to invest. Past performance does not necessarily indicate a financial product’s future performance. To obtain advice tailored to your situation, contact a professional financial adviser. Articles are current as at date of publication.
This website contains information and opinions provided by third parties. Inclusion of this information does not necessarily represent Morningstar’s positions, strategies or opinions and should not be considered an endorsement by Morningstar.