Register For Our Mailing List

Register to receive our free weekly newsletter including editorials.

Home / 601

This 'forgotten' inflation indicator signals better times ahead

In the middle of last year I wrote about the relationship between money supply growth and prices growth (aka inflation) – see this article from Firstlinks. I’ve been asked for an update on how the story is playing out, so here we go.

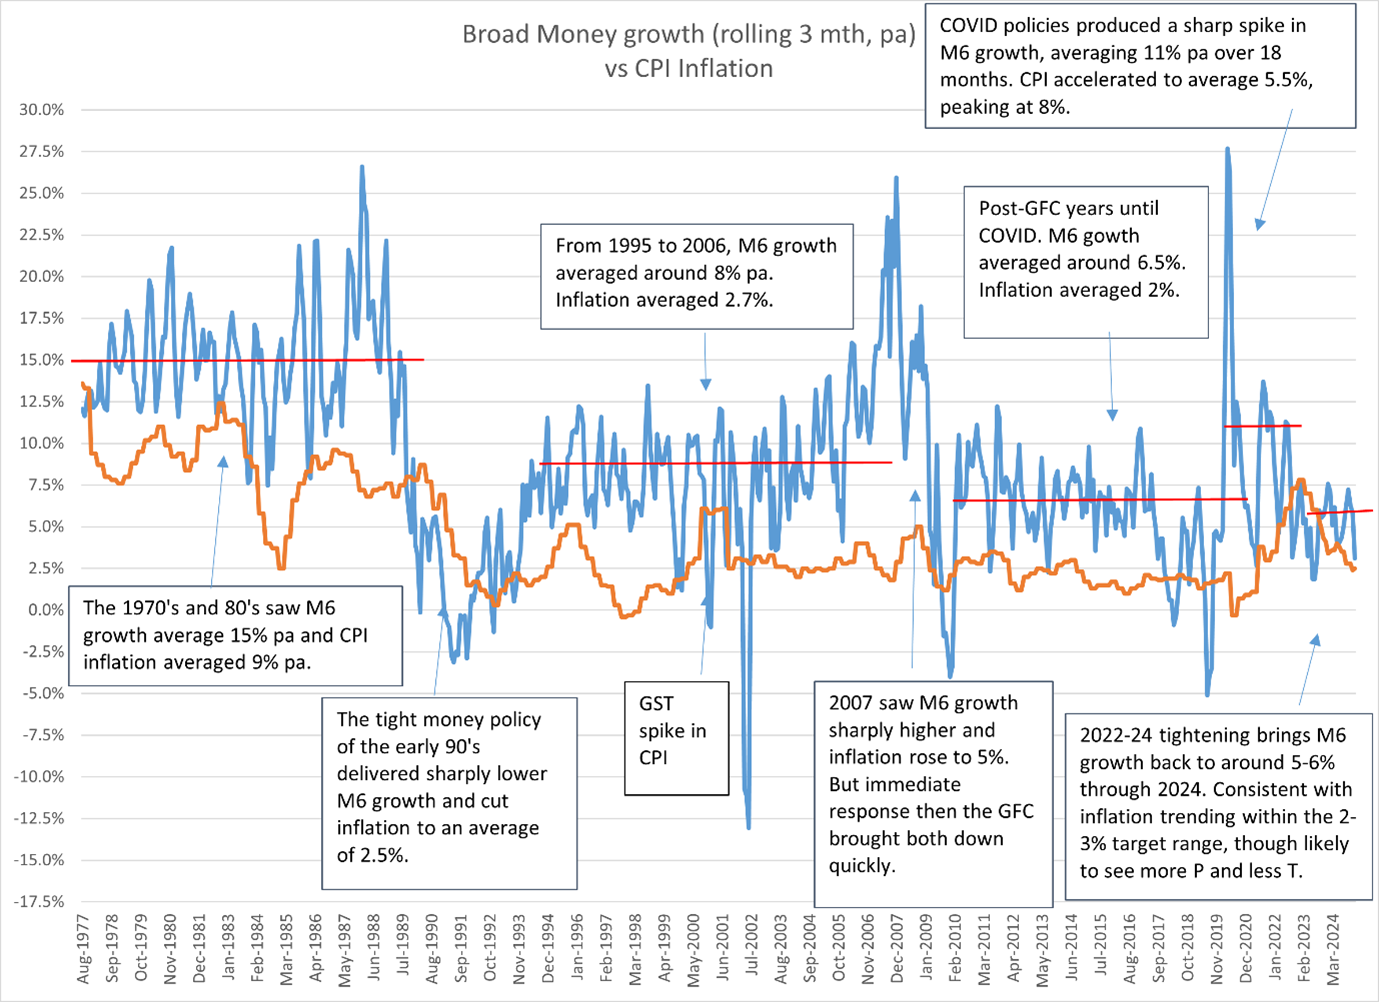
In that article, I noted that the annual growth rate of broad money (aka M6) had dipped to 4% in early 2024 but appeared to be trending at around 6%. I proposed that, if this trend rate continued, then that was consistent with inflation heading back into the 2-3% band. On that basis, there would be an emerging case through late 2024 into 2025 for the cash rate to be reduced, though even then I was suggesting that reductions would or should only be modest, into a ‘neutral’ policy range of 3.75-4.0%.

It's played out that way

That’s pretty much what we’ve seen since. M6 growth did accelerate from 4% back up to 5-6% through the spring of 2024 but has slipped again in the summer (to just over 3% p.a.). It continues to trend at around 6%, though possibly a little on the weaker side of that number. In the 6 months since I wrote the article the annualised growth rate has been only 5.2%.

At the same time, inflation has declined from 4% to less than 3%. The CPI figures – both quarterly and monthly – are posting year-to rates at 2.5%.

Many are quick to point out that these outcomes have been manipulated to the downside to some extent by the Government’s energy rebate payments and point to the year-to rate of inflation measured by the trimmed mean of the CPI still being at 3.2% in 2024. I have two responses to that:

  1. I acknowledge that it’s mathematically true, but ask “so what?” I argue that lower actual inflation rates, from whatever source they come, can be expected to feed into inflation expectations, creating a self-reinforcing trend in the economy.
  2. To also point out that looking only at year-to rates of growth still includes too much of what was happening almost a year ago and doesn’t look closely enough at what’s going on now. And what’s going on now with trimmed mean inflation is that, for the second half of 2024, it was running at an annual rate of only 2.7%.

So I rest my case. Money growth has been 5-6% pa since I wrote my article and core inflation has slowed to 2.5-3.0%. Although the RBA still doesn’t mention the money supply data in its statements about policy, this is the undeniable background to the rate cut announced this month.

The cash rate of 4.35% did its job. It got inflation down from 8% to less than 3%. It did that by changing the demand for and supply of credit, which is captured in the money supply data. Hence, M6 growth has also slowed from its double-digit levels in 2020-22 to the recent 5-6%.

In the past, M6 growth at this rate lined up with inflation below 2.5%. Unless there’s an over-reaction by borrowers to this month’s rate cut, resulting in a rebound in money growth, this means that the macro environment shows some strong evidence that the RBA’s new inflation target is well within reach.

Here’s an update of the chart that I included in last year’s article.

One RBA review error

I can’t let what I just had to say pass without comment. Of all the things to come out of the review of the RBA, the change from the target being expressed as inflation of “2-3% on average over the cycle” to targeting the mid-point of that range, 2.5%, is the most disappointing and unnecessary. The rationale for the previous formulation was well argued by successive Governors and Deputy Governors over many years. It is a clear commitment to inflation management at a sensible level but doesn’t have the misleading appearance of fine-tuning precision that a spot point target has. Saying that the target is 2.5% simply invites market pedants and the media to quibble if we were to get a reading of 2.4% or 2.6% that policy must be changed to achieve the target.

Money supply is not the whole story for inflation or monetary policy, but it provides an early and good read on whether the cash rate setting is transmitting to accelerating, steady or slowing price pressures. That is, it helps to evaluate if a policy change is working or not. It supports last month’s rate cut decision and I will continue to watch these data in the coming months to understand how much of an impact the cut to 4.1% is having.


Warren Bird has over 40 years’ experience in public service, business leadership and investment management. He is currently a Director of the WA Government Employees Super Board (GESB) and Chair GESB’s Investment Committee. He is also Chair of the independent Audit and Risk Committee of the Illawarra Shoalhaven Local Health District. This article reflects the personal views of the author.


  •   5 March 2025
  • 5
  •      
  •   
5 Comments
Chris Jackson
March 07, 2025

Thank you the update that I asked for Warren. Much appreciated.

Warren Bird
March 07, 2025

No worries Chris. If you're on LinkedIn then look out for my monthly updates. I share them to the public, not just to contacts.

Jim
March 07, 2025

The numbers don't tell the impact of potential tariffs on the world and how that will gummy up supply chains. I have relatives who own small businesses in Canada - tariffs are already causing carnage with supplys and prices are up 20-25%. A whole new world.

Warren Bird
March 07, 2025

Jim, tariffs can only become inflationary beyond the short term if monetary policy allows it to and money supply growth accommodates it. Their main impact after the short term is to crunch growth. The 1930s were deflationary despite the "beggar-thy-neighbour" tariff policies.

Dudley
March 07, 2025

"tariffs can only become inflationary beyond the short term if monetary policy allows it to and money supply growth accommodates it":

We have just exited a short term supply chain restriction, which resulted in a little burst of price inflation and delayed interest rate increases.
The cumulative after tax, after inflation, interest on capital has not caught up with cumulative inflation because interest rates have not been large enough for long enough.
Deposit interest rates about 2.25% after 45% taxation and 3% inflation required for about 10 years to close the gap.
Nominal deposit rate:
= ((1 + 3% / (1 - 47%)) - 1) + 2.25%
= 7.9%

Currently, nominal deposit rates are ~5% due to expectation of further disinflation.

In some countries import tariffs will result in another similar bout of inflation.


Leave a Comment:

RELATED ARTICLES

This vital yet "forgotten" indicator of inflation holds good news

Former RBA Governor on why interest rates won't come down soon

CPI may understate the rising costs of retirement

banner

Most viewed in recent weeks

How cutting the CGT discount could help rebalance housing market

A more rational taxation system that supports home ownership but discourages asset speculation could provide greater financial support to first home buyers.

3 ways to fix Australia’s affordability crisis

Our cost-of-living pressures go beyond the RBA: surging house prices, excessive migration, and expanding government programs, including the NDIS, are fuelling inflation, demanding bold, structural solutions.

Is there a better way to reform the CGT discount?

The capital gains tax discount is under review, but debate should go beyond its size. Its original purpose, design flaws and distortions suggest Australia could adopt a better, more targeted approach.

Want your loved ones to inherit your super? You can’t afford to skip this one step

One in five Australians die before retirement and most have not set up their super properly so their loved ones can benefit from all their hard work and savings. 

Welcome to Firstlinks Edition 648 with weekend update

This is my last edition as Editor of Firstlinks. I’m moving onto a new role though the newsletter will remain in good hands until my permanent replacement is found.

  • 5 February 2026

Super is catching up, but ageing is a triple-threat

An ageing Australia is shifting the superannuation system’s focus from accumulation to the lifecycle of retirement. While these pressures have been anticipated for decades, they are now converging at scale and driving widespread industry change.

Latest Updates

Economy

Has Australia wasted the last 30 years?

The 20 years after Peter Costello left Treasury have been deemed wasted...by Peter Costello. The missed opportunities for Australia began long before.  

Retirement

Navigating the next stage of life in retirement

Retirement planning is more than just saving enough money. Long-term care needs, housing choices, and social networks are just as critical for a happy and enjoyable life.

Strategy

Showcasing your value in the age of AI shortcuts

Knowledge is becoming commoditized in the age of artificial intelligence but experience, taste, and judgement are still at a premium.

Planning

Financial advice as the pathway to economic security

Financial advice can lead to improved financial literacy, a healthier super balance and a higher standard of living in retirement. Is now the time to give yourself the gift of financial advice?

Economy

The overlooked driver of energy inflation

The impact of energy policy on inflation in Australia is often overlooked. Transitioning to renewable energy can lead to inflated costs that affect the entire economy and productivity growth.

Economy

A 2026 rotation story: Europe’s undervalued small caps

In 2026, Europe is poised for a 'Goldilocks' scenario with cooling inflation and lower rates, driven by fiscal stimulus. Small caps offer an attractive entry point before capital rotation.

Investment strategies

What we do when things go up (a lot)

Recent price spikes, particularly gold's surge, trigger behavioral responses like availability bias, storytelling, extrapolation, and FOMO, which create self-reinforcing feedback loops influencing investor sentiment and market trends.

Sponsors

Alliances

© 2026 Morningstar, Inc. All rights reserved.

Disclaimer
The data, research and opinions provided here are for information purposes; are not an offer to buy or sell a security; and are not warranted to be correct, complete or accurate. Morningstar, its affiliates, and third-party content providers are not responsible for any investment decisions, damages or losses resulting from, or related to, the data and analyses or their use. To the extent any content is general advice, it has been prepared for clients of Morningstar Australasia Pty Ltd (ABN: 95 090 665 544, AFSL: 240892), without reference to your financial objectives, situation or needs. For more information refer to our Financial Services Guide. You should consider the advice in light of these matters and if applicable, the relevant Product Disclosure Statement before making any decision to invest. Past performance does not necessarily indicate a financial product’s future performance. To obtain advice tailored to your situation, contact a professional financial adviser. Articles are current as at date of publication.
This website contains information and opinions provided by third parties. Inclusion of this information does not necessarily represent Morningstar’s positions, strategies or opinions and should not be considered an endorsement by Morningstar.