Most investors focus on returns, but this paper is about the other side of the risk-reward equation: risk. More specifically, it is about volatility.
2012 was a great year for returns – but what about volatility?
2012 was a great year for investors just about everywhere in the world. Almost every stock market in the world was up (including Australia), every bond market was up (including Australia), commercial property was up in most countries (including Australia), and even gold was up. It was a very rare year in which every major investment asset class was not only up, but ahead of inflation and also ahead of returns on cash and bank deposits. Furthermore, every major asset class did better than its expected long term average return (while acknowledging that housing is a difficult 'asset class' to measure because every house is different, and we don’t have reliable data for Australia for 2012 yet).
But enough about returns in 2012. What about all that volatility we keep reading and hearing about in the media?
‘Risk’ v ‘volatility’
First we need to define risk and volatility. In designing and managing investment portfolios for investors I prefer to define ‘risk’ in terms of several real life risks faced by investors. These real life risks include: the risk of suffering a permanent loss of capital, the risk of running out of money, the risk of failing to achieve specific financial objectives, the risk of declining real purchasing power after inflation, the risk of failing to achieve specific cash flow withdrawals from the portfolio, and other critical investor-related measures.
On the other hand, finance textbooks define risk as ‘volatility’, which is expressed in terms of the variation of actual returns or prices around the average return.
‘These volatile times!’
According to the populist media, we are being told constantly that markets are experiencing unprecedented volatility and turbulence. This is the consistent and relentless message being conveyed by the media everywhere, including (and especially) the financial newspapers and those shrill presenters and experts on the 24/7 news and financial news channels. It seems every second sentence is peppered with alarmist terms.
We don’t listen to the populist media. We stick to the facts. Contrary to all the alarmist headlines, 2012 was in fact the calmest year on markets for at least half a decade, on any measure of volatility.
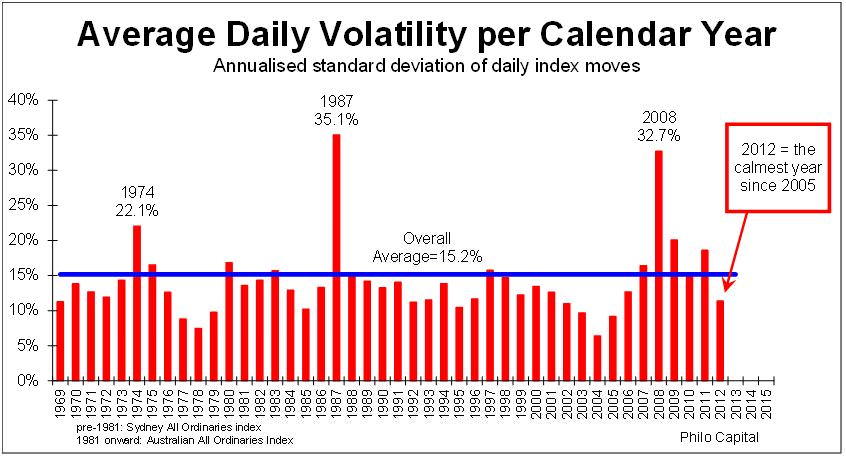
Measuring volatility using the textbook definition (the ‘standard deviation’) of daily moves of the All Ordinaries index, 2012 had the lowest average daily volatility of any year since 2005:

In fact, the real story of volatility on the Australian stock market over the past year has been the great decline in volatility in the years since 2008, to the unusually low levels of volatility at present.
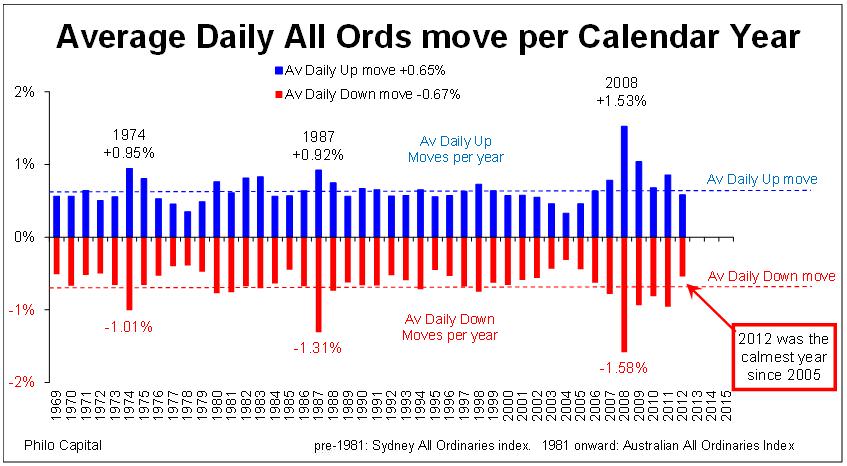
A more meaningful way of measuring volatility is to look at daily moves, since it is the daily moves that grab the media headlines. We separate daily ‘up’ moves from ‘down’ moves because most people worry more about down moves.
In 2012 the average daily down moves were well below the long term average down move and were the smallest since 2005:

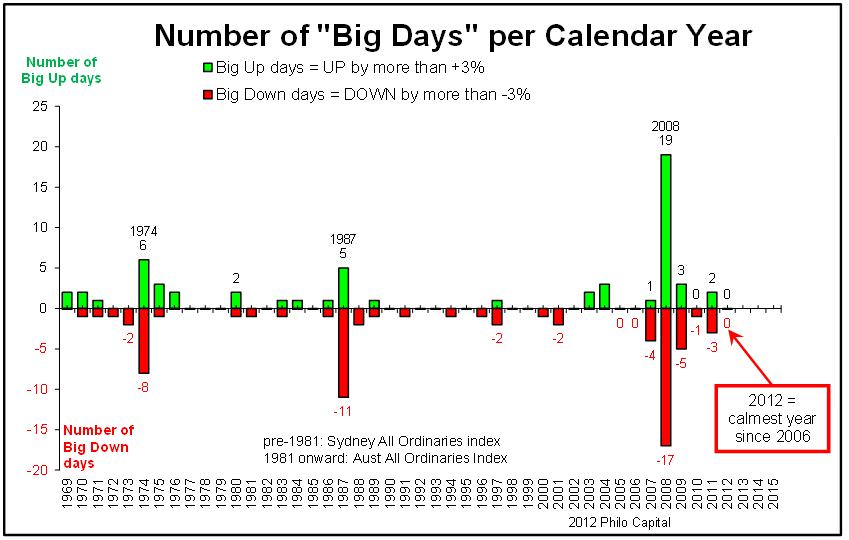
An even more targeted measure of volatility is to look beyond average moves to see how many big days there were, again separating the big up days from the big down days. No matter where we set the threshold for the definition of a ‘big’ day, 2012 was a very smooth year indeed.
For example, if we set the threshold at 3% as a big day, there were no big down days at all in 2012 (or any big up days either). Compare this to a gut-wrenching 17 days in 2008 when the overall market fell by more than 3%, including five days on which the whole market fell by more than 5% in 2008.

The above charts are for the Australian stock market, but it is the same pattern in all other major global markets. For example, 2012 in the US stock market was also the calmest year since 2005 or 2006 depending on the measure used.
The worst day of the year
The worst day on the Australian stock market in 2012 was Friday 18 May. It was a bad day coming at the end of a relatively bad week.
The week started with JP Morgan revealing another $2 billion derivatives trading loss (the ‘London Whale’ loss, which later turned out to be a $6 billion loss), the Greek parliament failing to form a coalition government after tortuous negotiations following the election, and the runs on Greek banks reaching a crescendo during the week, exacerbated by Moody’s downgrading of 16 major European banks on the Thursday (Europe time). To top it off, the European Central Bank started talking openly about emergency plans for a Greek exit from the Euro, the infamous ‘Grexit’. (Facebook’s disastrously mispriced float occurred after the market closed in Australia on that Friday, so it did not factor into Friday’s market here).
All of this had very little to do with Australia, but the local media were full of doom and gloom stories and many investors in Australia sold their shares in the media panic, causing the market to fall 2.6%.
So 18 May 2012 may have seemed volatile at the time, but it was mainly because 2012 was such a calm year. That is not to say that 2012 was not an eventful year. There were a host of reasons for investors to panic. There were rolling recessions in the UK, Europe and Japan, sluggish growth in the US, slowdowns in the major emerging markets including the prospect of a hard landing in China, political turmoil and rising violence in many countries, the fiscal cliff crises in the US and also in Japan, a global currency war, escalating military conflict between China and Japan, rising nuclear tensions in Iran, and North Korea setting off rockets over North Asia. On top of all this the local market in Australia was peppered all year with earnings downgrades from companies in almost every industry.
Yet, despite all of this going on, and all of the hype whipped up in the media about volatility in markets, 2012 was in fact almost dead calm.
In contrast, in 2008 was a volatile year. In 2008 there were 23 days (or 9% of all trading days over the entire year) in which the All Ordinaries index fell by more than 2.6%. That’s more than a whole month of trading days in 2008 that were each worse than the worst single day in 2012!
If the 2.6% fall on 18 May 2012 had occurred in 2008, it would have been seen as a quiet day when everyone would have let out a collective sigh of relief!
If we ignore the media hype and look at the facts, we see that 2012 was in fact a smooth sailing year on the market. Great returns and low volatility – investors could not wish for more.
Ashley Owen is Joint Chief Executive Officer of Philo Capital Advisers and a director of Third Link Investment Managers.