Register For Our Mailing List

Register to receive our free weekly newsletter including editorials.

Home / 294

Welcome to the Great Australian Deleveraging

Record levels of debt accompanied by declining asset prices means we have entered a deleveraging phase putting other spending on the backburner.

There’s a lot of chatter about the reasons why retail sales, consumer foot traffic, car sales and housing activity have plunged. From US/China trade tensions, to wobbles in the Chinese economy itself, to plunging house prices and to the upcoming federal election, analysts, brokers and commentators have taken a shotgun approach to pointing at the catalysts and causes.

The explanation however is much simpler.

Unprecedented household borrowing

In 2011, a study of the determinants of debt by the University of New England’s Sam Meng, Nam Hoang and Mahinda Siriwardana observed:

“Household debt in Australia has grown at an astonishing rate since the 1990s … the debt-income ratio jumped from 70.6% in 1990 to 162.8% in 2005. To put this into perspective, the average Australian household would have to work more than one and a half years just to pay off their debt.”

But that was then. Since 2005, Australia’s household debt has continued to soar. There is a simple explanation for the rapid increase in debt. Debt capacity is a function of its price. If interest rates halve, the borrower can ‘afford’ almost twice as much debt when borrowing interest-only, with no change in their income.

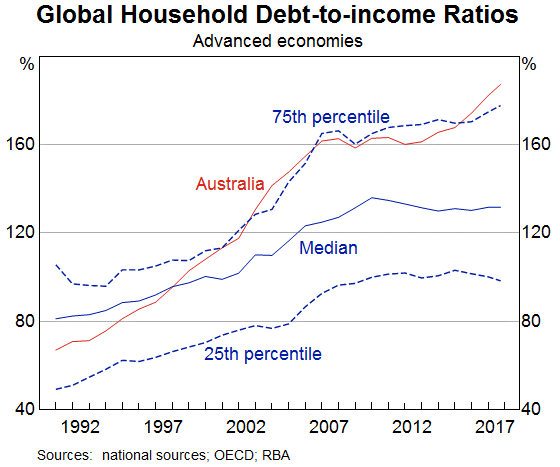
In September 2018, Michele Bullock, the Reserve Bank Assistant Governor responsible for the area that focuses on financial stability, observed that household debt in Australia has been rising relative to income for the past 30 years, and from around 70% to around 190%. Thank three decades of falling interest rates for that.

As the chart below reveals, Australia has not been unique in experiencing rising debt-to-income ratios. While the median ratio for a range of developed economies has also risen over the past 30 years, Australia’s debt-to-income ratio has risen more sharply. In fact, Australia has moved from the bottom third of countries sampled to the top quarter.

Australia’s debt binge relative to developed economies

The reason for the acceleration is householders’ belief that everyone can be a millionaire property mogul. Bullock observes, more diplomatically,

“the increase in household debt over the past few decades has been largely due to a rise in mortgage debt. And an important reason for the high level of mortgage debt in Australia is that the rental stock is mostly owned by households … This is different to many other countries where a significant proportion of the rental stock is owned by corporations or cooperatives.”

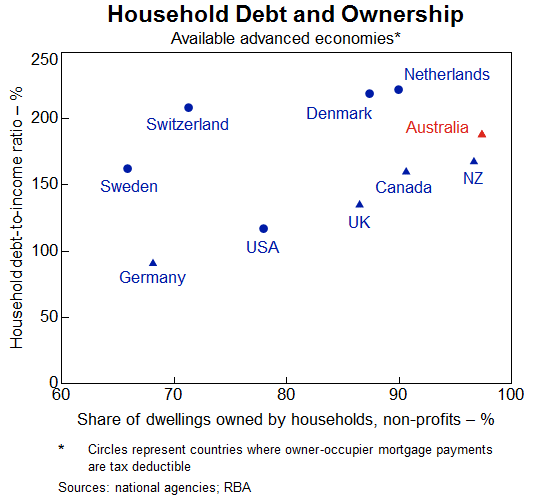
In other countries where the yield on rental properties is much more attractive, ‘mums and dads’ don’t invest as much in property. But here in Australia, where the net returns are often negative, mums and dads have piled in on top of each other to get a piece of the action In other words, would-be property moguls are committing to purchases where savvier investors fear to tread.

The proliferation of unsophisticated ‘mum and dad’ property moguls must also increase the probability of price volatility. And most busts are preceded by a period where a broad section of the population believes they can ‘get rich’.

Consequences of a period of deleveraging

On 15 February 2019, The Australian featured a story revealing terrifying house price falls. For example, for the year ending January 2019, Box Hill in NSW saw median prices fall more than 43%. In Victoria’s Red Hill, prices declined almost a third. A raft of suburbs has also fallen between 17% and 40% in just 12 months. Of course, nobody should be surprised.

Billionaire investor Warren Buffett has previously warned against any complacency surrounding debt, noting:

“It’s not debt per say that overwhelms an individual, corporation or country. Rather it is a continuous increase in debt in relation to income that causes trouble.”

In their book This Time Is Different: Eight Centuries of Financial Folly, Carmen Reinhart and Kenneth Rogoff noted that when housing booms are accompanied by sharp rises in debt, the risk of a crisis is significantly elevated.

Australia’s household debt must be reduced but the path that reduction takes has consequences for the Australian economy. One version of deleveraging allows for rising salaries to accelerate the repayment of debt but consumption still slows. A less desirable scenario sees no increase to income but rather an erosion of savings eventually forcing consumption cuts. Keep in mind, retail is the second largest employer in the country.

Finally, a much more volatile outcome adds rising mortgage interest rates (out-of-cycle possibly), which adversely impacts household budgets, producing negative equity, heavy debt burdens and a full-blown economic or financial crisis. Consumers are then left with an extremely high level of gearing, such that a small change in their income makes a big difference to their discretionary spending. The rollover from fixed rate to variable rate mortgages could be part of this income shock.

A hypothetical ability to increase debt levels allows a consumer to pay more for a property, or to spend more on goods and services beyond the amount of income earned. But when the cost of debt increases, the need to reduce debt levels sends everything into reverse. Consumers need to spend less than they earn, or the amount they can pay for a property declines. Both are now evident in Australia.

Throughout modern history, financial crises have been followed by an average of six or seven years of deleveraging. But deleveraging can occur in the absence of a crisis. This is where credit growth lags GDP growth – call it “belt tightening”. Such debt-to-GDP ratio declines, in the absence of a crisis, have been observed in Canada (1988-1994), Switzerland (1969-74), Belgium (1997-2004), Ireland (1988-1994) and in many other countries.

My biggest worry

With house prices now declining substantially, their record debt is what households will focus on.  The biggest concern I have, that many analysts seem to ignore, is that after house prices begin softening, the savings ratio begins climbing, reflecting a lack of consumer confidence (note Westpac's reference to confidence 'evaporating' below) leading to a much more rapid slowdown in the economy.

Credit growth is already slowing and possibly faster than GDP. And that means a decline in retail spending, precisely what we are now seeing. Big ticket items are the first to see the tide go out. Nationally, Mercedes Benz car sales fell 43% year-on-year in November 2018 and Ford car sales fell 41%. Retail fashion sales slumped 3.8%, and as foot traffic plunged, Westpac reported consumer confidence had 'evaporated'.

Following any debt binge there must be a period of indigestion, followed by digestion. During a period of deleveraging, there is a much higher risk of negative surprises. Therefore, Australia is likely to enter a period of greater volatility in asset prices and economic conditions. For many borrowers now under water, the period of digestion will mean slow and steady repayments, for others at the pointier end of debt-to-income spectrum, expect forced asset sales.

In the meantime, whichever path is taken to reduce debt, expect retail sales and house prices to soften further. And then expect some time to pass before any sustained recovery occurs.

Welcome to the GAD – the Great Australian Deleveraging.


Roger Montgomery is Chairman and Chief Investment Officer at Montgomery Investment Management. This article is for general information only and does not consider the circumstances of any individual.


6 Comments
Nick
February 21, 2019

Nice Article Roger, Do you happen to have any links to articles that explain the effect of a deleveraging on the different asset classes? Thanks

Dane
February 21, 2019

Ironic that there is only one comment on this article versus 100 you will see on anything that touches on Labor's proposed changes to franking credits. Any significant amount of household deleveraging over an extended period against a backdrop of slowing credit growth will most likely have profound implications for attractiveness of bank shares. Most at risk will be dividends, which could be reduced significantly if banks are forced to fortify their capital. The $ impact of any cuts could potentially be far greater than the value of franking credits to 0% tax-paying investors. Franking credits don't exist without dividends. The lack of interest from the readership is perplexing.

Outside of this observation the risks highlighted by Roger are very real. I think he has done a good job of outlining the potential scenarios, none of which will be conducive to consumption. Under the goldilocks scenario, even if RBA gets is 3-4% wage growth, at some point households will need to start paying down debt, which means less consumption.

john gannon
February 21, 2019

I can't 'feel' this deleveraging in the everyday but this analysis - amongst a lot of negative talk - makes me think that something is afoot.

Perhaps this is how this works - the deleveraging sneaks up on you and hits you on the head.

Will be interesting to check how things are in August and if the mood has changed.

David
February 21, 2019

Dane, you Sir are on the money. If only the herd was less worried about the franking credit gravy train coming to an end, and instead focusing on the real risks as highlighted by the very wise Roger.

Hugh
February 20, 2019

Great analysis Roger
Is the Great Australian Deleveraging AUD positive? Australia has no consumer durable (cars, whitegoods and furniture) manufacturing base to speak of, so as consumers tighten their belts, less will be imported, thus will the resultant trade surpluses appreciate the AUD? Or do you think other factors, like overseas borrowing, will overwhelm the reduction in imports, resulting in the deleveraging being negative for the Australian Dollar?
Cheers

SG
March 01, 2019

RBA likely to drop rates to stem the tide of declines which will lead to a depreciating AUD currency especially given the rest of the world is looking to raise.


Leave a Comment:

RELATED ARTICLES

Global recession looms as debt balloons

Financial leverage in real estate: friend or foe?

banner

Most viewed in recent weeks

7 examples of how the new super tax will be calculated

You've no doubt heard about Division 296. These case studies show what people at various levels above the $3 million threshold might need to pay the ATO, with examples ranging from under $500 to more than $35,000.

The revolt against Baby Boomer wealth

The $3m super tax could be put down to the Government needing money and the wealthy being easy targets. It’s deeper than that though and this looks at the factors behind the policy and why more taxes on the wealthy are coming.

Meg on SMSFs: Withdrawing assets ahead of the $3m super tax

The super tax has caused an almighty scuffle, but for SMSFs impacted by the proposed tax, a big question remains: what should they do now? Here are ideas for those wanting to withdraw money from their SMSF.

Are franking credits hurting Australia’s economy?

Business investment and per capita GDP have languished over the past decade and the Labor Government is conducting inquiries to find out why. Franking credits should be part of the debate about our stalling economy.

Here's what should replace the $3 million super tax

With Div. 296 looming, is there a smarter way to tax superannuation? This proposes a fairer, income-linked alternative that respects compounding, ensures predictability, and avoids taxing unrealised capital gains. 

The huge cost of super tax concessions

The current net annual cost of superannuation tax subsidies is around $40 billion, growing to more than $110 billion by 2060. These subsidies have always been bad policy, representing a waste of taxpayers' money.

Latest Updates

Superannuation

Here's what should replace the $3 million super tax

With Div. 296 looming, is there a smarter way to tax superannuation? This proposes a fairer, income-linked alternative that respects compounding, ensures predictability, and avoids taxing unrealised capital gains. 

Superannuation

Less than 1% of wealthy families will struggle to pay super tax: study

An ANU study has found that families with at least one super balance over $3 million have average wealth exceeding $19 million - suggesting most are well placed to absorb taxes on unrealised capital gains.   

Superannuation

Are SMSFs getting too much of a free ride?

SMSFs have managed to match, or even outperform, larger super funds despite adopting more conservative investment strategies. This looks at how they've done it - and the potential policy implications.  

Property

A developer's take on Australia's housing issues

Stockland’s development chief discusses supply constraints, government initiatives and the impact of Japanese-owned homebuilders on the industry. He also talks of green shoots in a troubled property market.

Economy

Lessons from 100 years of growing US debt

As the US debt ceiling looms, the usual warnings about a potential crash in bond and equity markets have started to appear. Investors can take confidence from history but should keep an eye on two main indicators.

Investment strategies

Investors might be paying too much for familiarity

US mega-cap tech stocks have dominated recent returns - but is familiarity distorting judgement? Like the Monty Hall problem, investing success often comes from switching when it feels hardest to do so.

Latest from Morningstar

A winning investment strategy sitting right under your nose

How does a strategy built around systematically buying-and-holding a basket of the market's biggest losers perform? It turns out pretty well, so why don't more investors do it?

Sponsors

Alliances

© 2025 Morningstar, Inc. All rights reserved.

Disclaimer
The data, research and opinions provided here are for information purposes; are not an offer to buy or sell a security; and are not warranted to be correct, complete or accurate. Morningstar, its affiliates, and third-party content providers are not responsible for any investment decisions, damages or losses resulting from, or related to, the data and analyses or their use. To the extent any content is general advice, it has been prepared for clients of Morningstar Australasia Pty Ltd (ABN: 95 090 665 544, AFSL: 240892), without reference to your financial objectives, situation or needs. For more information refer to our Financial Services Guide. You should consider the advice in light of these matters and if applicable, the relevant Product Disclosure Statement before making any decision to invest. Past performance does not necessarily indicate a financial product’s future performance. To obtain advice tailored to your situation, contact a professional financial adviser. Articles are current as at date of publication.
This website contains information and opinions provided by third parties. Inclusion of this information does not necessarily represent Morningstar’s positions, strategies or opinions and should not be considered an endorsement by Morningstar.