Register For Our Mailing List

Register to receive our free weekly newsletter including editorials.

Home / 18

What do bond and equity yield differentials tell us?

With the exception of the immediate post World War II period, history is not kind to equity markets when interest rates are low and not falling. Either interest rates remain low, in which case we have a Japan-type situation, or interest rates rise and we finish up with negative equity risk premiums (that is, the return that the equity market provides over the bond rate is negative). Either way the outcome is not good for equities.

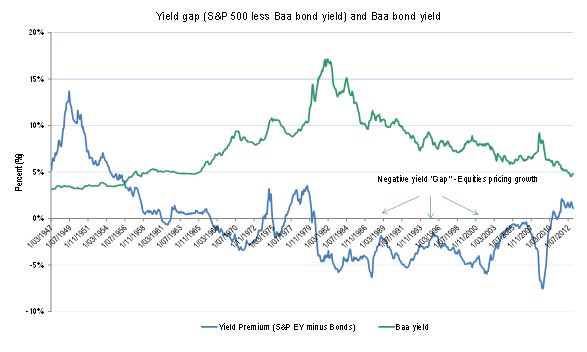
The chart below shows the yield gap or margin between the earnings yield on the S&P 500 and the Baa bond yield since 1947 (when equity yields exceed bond yields, the margin is negative). The chart also shows and the outright level of Baa bond yields. When the yield gap is positive, Price/Earnings are relatively low. When the yield gap is negative (line below the horizontal axis) investors are buying equities at lower yields (higher P/Es) than Baa bonds because they are anticipating economic and earnings growth. Note that earnings yield (E/P) is the inverse of the P/E ratio.

Two trends are apparent. Firstly, interest rates have been falling steadily for the past 30 years and secondly, over much of the same time frame the US has experienced a negative yield gap (i.e. investors are pricing in earnings growth).

Does the yield gap matter?

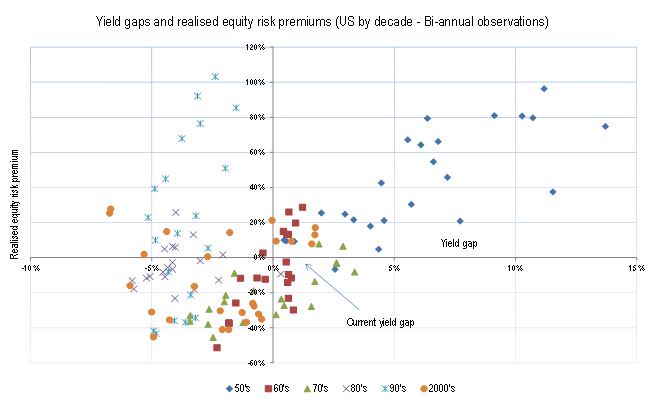
In the following chart, we have compared the yield gap on the horizontal axis and subsequent realised equity risk premiums on the horizontal axis. A positive yield gap results from either relatively low Baa bond yields or low P/E’s with the realised equity risk premium being the difference between the Baa bond yield at the time and the subsequent 5 year equity returns.

If equities outperform Baa bonds, a positive equity risk premium exists. A position in the top left hand quadrant indicates negative yield gaps (expensive P/E’s or high bond yields) and equity markets performing better than bonds, while the bottom right hand quadrant indicates positive yield gaps where bonds outperformed equities.

A bit of history

There were two decades where equities outperformed Baa bonds: the 1950’s and the early 1990’s. In the case of the 1950’s, it was after a 15 year period when there had been a global depression and a world war. Not surprisingly, there may have been some pent up investor pessimism, but despite this both GDP and earnings grew strongly contributing to the excellent equity outcomes.

The early 1990’s was another interesting case where a combination of good GDP growth, after the 1991 recession, produced explosive earnings growth and there was some P/E contraction. Interest rates fell strongly over the period which would have affected both the economy and P/E contraction. Sadly, most other decades haven’t been as rewarding.

What are the lessons?

If history repeats or even rhymes, it’s not looking particularly positive for equities despite the low absolute level of interest rates and undemanding P/E’s. This is because it is the direction of interest rates rather than the absolute level of interest rates that seems to be a substantive driver of equity returns. Prior to the 1970s, rising interest rates meant poor future equity market returns.

We have just experienced a 30 year bull interest rate market and have no more recent parallels. Within the last 30 years most periods when equities outperformed bonds have occurred when interest rates are ‘falling’ rather than when interest rates are ‘flat’. Interest rates are currently at emergency lows and are more likely to rise than fall from this point. Based on past evidence, equities are unlikely to outperform bonds in this case.

And if interest rates don’t rise? The only parallel we can find for a case of sustained low interest rates is Japan and that is not a pretty outcome for equity markets. Equity markets in Japan have underperformed bond markets in 12 of the 15 rolling 5 year return periods since 1993. This translated to a gross equity underperformance of the bond market by a staggering 70%.


Norman Derham is on the executive at Elstree Investment Management. Elstree is a boutique fixed income fund manager.


  •   7 June 2013
  • 1
  •      
  •   

RELATED ARTICLES

The best strategy to build income for life

The far-flung past as prologue

The familiar story on dividends, plus predictions for 2023

banner

Most viewed in recent weeks

Building a lazy ETF portfolio in 2026

What are the best ways to build a simple portfolio from scratch? I’ve addressed this issue before but think it’s worth revisiting given markets and the world have since changed, throwing up new challenges and things to consider.

Get set for a bumpy 2026

At this time last year, I forecast that 2025 would likely be a positive year given strong economic prospects and disinflation. The outlook for this year is less clear cut and here is what investors should do.

Meg on SMSFs: First glimpse of revised Division 296 tax

Treasury has released draft legislation for a new version of the controversial $3 million super tax. It's a significant improvement on the original proposal but there are some stings in the tail.

Ray Dalio on 2025’s real story, Trump, and what’s next

The renowned investor says 2025’s real story wasn’t AI or US stocks but the shift away from American assets and a collapse in the value of money. And he outlines how to best position portfolios for what’s ahead.

10 fearless forecasts for 2026

The predictions include dividends will outstrip growth as a source of Australian equity returns, US market performance will be underwhelming, while US government bonds will beat gold.

13 million spare bedrooms: Rethinking Australia’s housing shortfall

We don’t have a housing shortage; we have housing misallocation. This explores why so many bedrooms go unused, what’s been tried before, and five things to unlock housing capacity – no new building required.

Latest Updates

3 ways to fix Australia’s affordability crisis

Our cost-of-living pressures go beyond the RBA: surging house prices, excessive migration, and expanding government programs, including the NDIS, are fuelling inflation, demanding bold, structural solutions.

Superannuation

The Division 296 tax is still a quasi-wealth tax

The latest draft legislation may be an improvement but it still has the whiff of a wealth tax about it. The question remains whether a golden opportunity for simpler and fairer super tax reform has been missed.

Superannuation

Is it really ‘your’ super fund?

Your super isn’t a bank account you own; it’s a trust you merely benefit from. So why would the Division 296 tax you personally on assets, income and gains you legally don’t own?

Shares

Inflation is the biggest destroyer of wealth

Inflation consistently undermines wealth, even in low-inflation environments. Whether or not it returns to target, investors must protect portfolios from its compounding impact on future living standards.

Shares

Picking the next sector winner

Global equity markets have experienced stellar returns in 2024 and 2025 led, in large part, by the boom in AI. Which sector could be the next star in global markets? This names three future winners.

Infrastructure

What investors should expect when investing in infrastructure: yield

The case for listed infrastructure is built on stable earnings and cash flows, which have sustained 4% dividend yields across cycles and supported consistent, inflation-linked long-term returns.

Investment strategies

Valuing AI: Extreme bubble, new golden era, or both

The US stock market sits in prolonged bubble territory, driven by AI enthusiasm. History suggests eventual mean reversion, reminding investors to weigh potential risks against current market optimism.

Sponsors

Alliances

© 2026 Morningstar, Inc. All rights reserved.

Disclaimer
The data, research and opinions provided here are for information purposes; are not an offer to buy or sell a security; and are not warranted to be correct, complete or accurate. Morningstar, its affiliates, and third-party content providers are not responsible for any investment decisions, damages or losses resulting from, or related to, the data and analyses or their use. To the extent any content is general advice, it has been prepared for clients of Morningstar Australasia Pty Ltd (ABN: 95 090 665 544, AFSL: 240892), without reference to your financial objectives, situation or needs. For more information refer to our Financial Services Guide. You should consider the advice in light of these matters and if applicable, the relevant Product Disclosure Statement before making any decision to invest. Past performance does not necessarily indicate a financial product’s future performance. To obtain advice tailored to your situation, contact a professional financial adviser. Articles are current as at date of publication.
This website contains information and opinions provided by third parties. Inclusion of this information does not necessarily represent Morningstar’s positions, strategies or opinions and should not be considered an endorsement by Morningstar.