Many investors worry about their share portfolios. What if the next big fall is just around the corner? Will there be another pandemic like COVID-19 which saw the All Ordinaries index retreat almost a third in a month? Can investors afford such a big hit?
It all boils down to risk tolerance levels and the proverbial sleep-at-night factor. Can you reduce your risk while retaining share market exposure?
There is a way to protect portfolios and reduce risk by using options as a hedging strategy, an approach often referred to as portfolio insurance.
How do put options work?
In an earlier article, I described an option as being a contract that gives the owner the right to buy (a ‘call’ option) or sell (a ‘put’ option) without obligation, a specific security at a specified price, on or before a specified date. The underlying security may be an individual stock or a sharemarket index. Options are versatile investment instruments, used to speculate, hedge risk, or derive income.
The hedging strategy works like this. I own a share in company ABC, currently trading at a price of $10 in the market. I want to maintain exposure to upside potential while eliminating downside risk. I therefore buy a put option at a price that gives me the right to sell my share at $10, on or before a future date.
If the share price exceeds $10 before the specified date, the option expires worthless and I can choose to retain or sell my share. If the share price is less than $10, I exercise my put option and sell the share for $10.
Options have a cost, but is it worth it?
In effect, I have insured against the share losing value, but reducing risk does not come without cost. Options cost money, and investors are often reluctant to protect their portfolios by purchasing put options, because they eat into income, often exceeding dividends received.
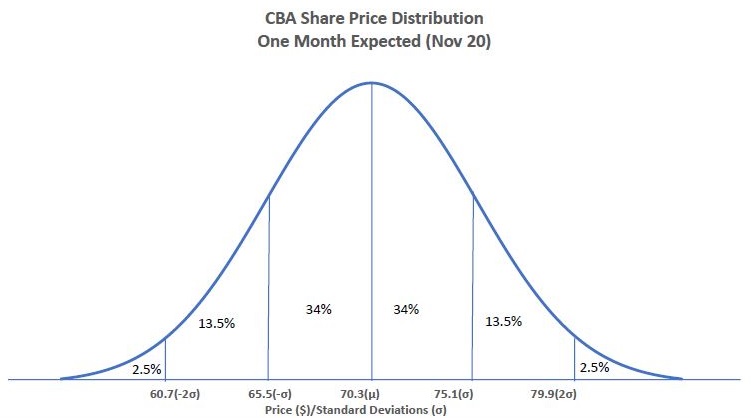
A key driver of price of the put option, called the premium, is volatility. Volatility in this context refers to expectations of variability in the stock’s price movements, or the standard deviation of the stock’s returns over a period (see the CBA example below). It is a forward-looking measure in option pricing. The higher the expected volatility, the more expensive the option, which would seem intuitive.
Take a simple example of a stock currently trading at $100. An option on that stock is priced with forward volatility of 10%, or one standard deviation. That means the market expects the stock to trade between $90 and $110, being plus or minus one standard deviation, 67% of the time. And it expects the stock to trade between $80 and $120 (plus or minus two standard deviations), 95% of the time (meaning less than $80 is only 2.5% of the time). Such price movements assume that stock returns are normally distributed.
A specific example using CBA
Consider now some real and current option premiums, such as CBA shares. The share price was trading on 20 October 2020 at $70.30. If I owned that stock and wanted close to full downside protection for the next month, I would buy a 19 November 2020 $70 put option, which was trading at a cost of $1.72. The cost in percentage terms was 2.4% of the value of the stock.
Clearly, rolling that type of protection over month after month, would become quite expensive. Over a year, the cost of protection would be approximately 29%, which dilutes the return on the portfolio considerably.
Investors simply would not be willing to pay for that level of insurance.
It is possible though to trade off some premium for an amount of risk by selecting an option at a lower strike price, much like a deductible (or excess) on car or home insurance. For example, downside risk may be limited to something arbitrary like say 5% or 10%, but a more sophisticated approach might set a dynamic threshold that moves with market volatility.
This can be achieved, for example, by calculating monthly volatility or one standard deviation, to limit the downside to 6.8% (see footnote for further explanation). In this case, we use a November $65 put, which could be purchased at a premium of $0.45. This reduces the insurance cost to 0.64% of the stock value, or about 7.7% rolled over for a year. A reduction in premium has been exchanged for exposure to some loss of value, and the cost is starting to become a little more palatable.
Investors, therefore, are able to select a strike price that matches their risk tolerance level.
But we can do better
Purchasing a put option provides protection from the strike price all the way down to a value of zero. Do we need that much protection? We have seen that the likelihood of a share falling more than two standard deviations is just 2.5%, much less going all the way to zero. So what if we took on still more risk, but with very low probability?
It is possible to negate the insurance below two standard deviations say, by ‘selling’ a put at that level. The downside risk is protected in the range from one to two standard deviations only. The 'sold put' is income offsetting the cost of the higher strike 'bought put'.
It works like this. One standard deviation is 6.8%, so again, a $65 put is bought for $0.45. And at two standard deviations, or movement of 13.6%, a $61 put is sold for $0.19. The net cost of the strategy being $0.26, or 0.37%, and an annualised cost of 4.4%, which may even be tax deductible, depending on an individual’s financial circumstances.
This may be a workable cost for risk-averse investors, wanting to maintain capital value at the expense of some income.
The possibilities for the spread of risk accepted are endless. A more risk-averse investor may wish to take less risk up front and more in the tail. For example, buy a put option at half a standard deviation from the current stock price, and sell a put one and a half standard deviations out, with a 6.7% probability of going below that.
As expiry nears ...
Just a note that if close to expiry, and the share price is trading below the bought put strike, the investor could do nothing and allow the option to be exercised. That is, the option seller would be obliged to buy the shares at the strike price above market. Or the investor could sell the put option, which would have value of approximately the difference between the strike price and the lower market price. The latter may be preferable if the investor wants to hold onto the shares and avoid buy/sell costs, and potential capital gains tax.
Hedging a share portfolio with put options is all about maximising upside potential and limiting downside risk. Like anything though, there is no such thing as a free lunch, and limiting losses costs money. With varying degrees of protection possible however, one can choose to spend as little or as much as their appetite for risk dictates.
Footnote on the 6.8% CBA downside example
The implied volatility is determined in the option pricing. One way to do this is to take the at-the-money put and call options, being those with strike price closest to the current stock price. Then calculate the implied volatility in both options, which can be done with a simple on-line calculator. Average the two volatilities, which should be similar, to obtain a proxy for our expected volatility of the stock. Note, this process will yield an annual volatility measure, which in this case must then be converted to the monthly equivalent.
Tony Dillon is a freelance writer and former actuary. This article is general information and does not consider the circumstances of any investor.