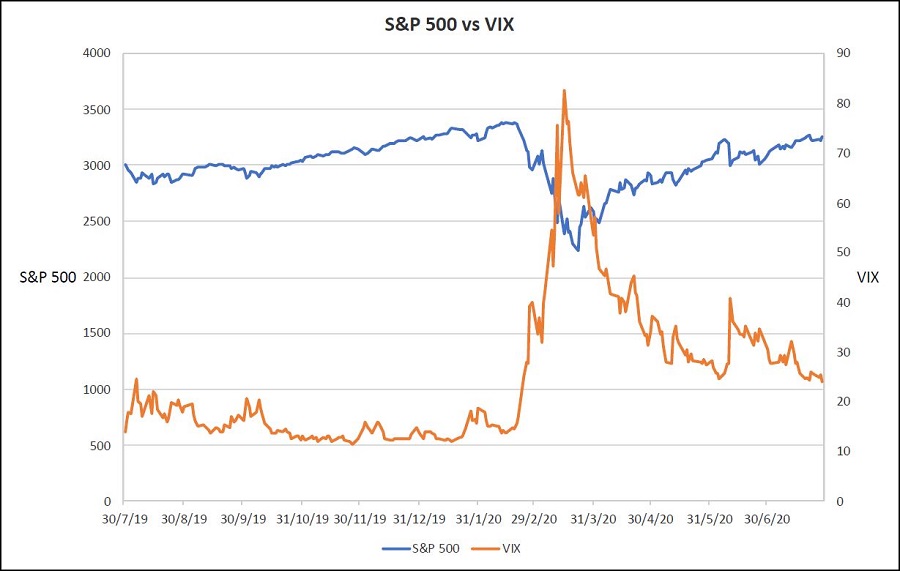
When COVID-19 unleashed itself in mid-March, the VIX exploded to a peak of about 83 points, up from just 14 when the US S&P500 index closed at a record high on 19 February. The lifetime average of the VIX is 19. But what do these values mean and how are they calculated?
The fear gauge grabs the headlines
Much has been made of the Chicago Board Options Exchange Volatility Index (VIX) in these COVID-19 times. Often referred to as the ‘fear gauge’, it measures volatility at a market level. Specifically, the VIX measures the market’s expectation of volatility in the S&P500 index.
It regularly features in discussion in financial circles in times of market turmoil, such as when the pandemic began to wreak havoc. And while the VIX itself is well known among investors, the interpretation of it is not.
As can be seen in the chart below over the last 12 months, an inverse relationship often exists between the S&P500 index and the VIX. When markets go into a tailspin, demand for portfolio hedging increases, concern mounts, and large fluctuations in daily price movements are expected and usually eventuate. So as markets plummet, volatility measures rise.
Volatility in this context, refers to the variability of a stock’s price, or market index. And a typical measure of that volatility is the standard deviation of the percentage change in stock price or index level over a period.
Standard deviation in this instance refers to the variability of the stock’s return around the mean of its return over a period. The greater the fluctuation, the larger the standard deviation. Hence a stock with a large standard deviation suggests that it is erratic in its performance with high variability of returns, and so it might be thought of as more risky.
Back to the VIX
The VIX is derived from exchange-traded options on the S&P500 market index, rather than the index itself. An option is a contract that gives the owner the right to buy (a ‘call’ option) or sell (a ‘put’ option) without obligation a specific security at a specified price, on or before a specified date. The underlying security may be an individual stock or a sharemarket index, like the S&P500.
Options are versatile investment instruments, used to speculate, hedge risk or derive income.
It is possible to calculate a theoretical, or fair market value, of an option using the universally-renowned options pricing tool, the Black-Scholes model. The inputs required are the option strike price, the option’s expiration date, a risk-free interest rate, and critically, anticipated and constant volatility up to the expiration date. The model also assumes that the returns on the underlying stock are normally distributed.
The key point is that the option’s modelled price is forward looking as far as volatility is concerned. That is, embedded in the price is expected future volatility, as opposed to historical volatility.
When stock or index options are traded in the open market, their price is subject to market forces, just as with any traded security. And the market price is usually different to the theoretical price due to normal supply and demand forces, liquidity, and fluctuating views underlying the option’s volatility expectations.
Given the market value of an option, therefore, it is possible to work backwards and calculate the volatility implicit in that price. Investors are then able to compare the implied volatility with their own volatility expectations, to potentially exploit any mispricing.
The concept of implied volatility is really what the VIX represents. It is essentially a hypothetical, implicit volatility measure based on multiple S&P500 index options. A basket of call and put options of varying strike prices, with expiry terms centred around 30 days, feed into the calculation.
So what is the VIX, in (relatively) simple terms?
In simplified terms, the calculation is an amalgam of weighted option prices, each with implicit volatility. It determines a contribution from each option according to strike price, strike price intervals, and the option’s market price. Mathematical manipulation results in a hybrid 30-day, S&P500 implied volatility measure, which is then annualised to give the final VIX value.
What does a calculated VIX value mean?
Consider the lifetime VIX average, a value of 19. This is an annualised figure for presentation. But recognising that the VIX is a 30-day volatility measure, it represents the expected range in which the S&P500 will trade over the next 30 days with a probability of 68%. That probability is the percentage of values one standard deviation (the VIX measure) either side of the mean of a normal distribution.
An annualised value of 19 converts back to a monthly value (standard deviation) of 5.5 (which for the mathematicians is 19 / v12). This means that the S&P500 index is expected to trade in a range 5.5% lower than its current level to 5.5% higher, 68% of the time in the next 30 days.
It also means the index should trade between -11.0% and 11.0% of its current value over the next month, 95% of the time, being the probability of being within two standard deviations either side of its value.
That the VIX could get to a peak of 83 on 16 March, as COVID-19 was exploding, meant that the market was expecting the S&P500 to move in a range of +/-24% over the ensuing month with a probability of 68%.
That is, not an insignificant probability (32%) that it could actually trade outside those bounds. Swings of that nature are almost unheard of.
The VIX as a measure of risk has a place in equity markets in interpreting market sentiment. But it is perhaps overly simplistic to think it can represent the volatility in equities as a whole.
Tony Dillon is a freelance writer and former actuary. This article is general information and does not consider the circumstances of any investor.