Over the last few months, the media have been full of scary-sounding headlines claiming 'extreme volatility' in markets. However if we look at the facts we see that the current level of 'volatility' is simply a return from 'dead calm' back to more usual levels.
If you think the current market is 'volatile' – then “you ain’t seen nothing yet!”
Well actually you have – much worse than the current so-called 'volatility' - and many times before. People have such short memories!
Most people didn’t realise we had higher volatility several times in the past because they were probably too busy doing other things – like working in their careers. Many more people are now ‘retired’ or taking an interest in their investments, which doesn’t mean they suddenly have to act on the daily chatter.
The facts on volatility
The recent headlines about extreme volatility are just media scare-mongering. Australian and global markets (shares, bonds, commodities, exchange rates) have been so calm for so long that investors and media commentators were simply asleep - lulled (or lullabied) into a false sense of security by unusually low volatility for so long.
Markets have been calm for four years following the Greece 2/US downgrade crisis in late 2011 up until the middle of 2015. During this ‘QE’ calm, markets were calmer for longer than they had ever been since the mid-1960s. Although markets are now more volatile than in QE years, volatility is still much lower now than it has been in many in more volatile episodes in recent decades.
Australian shares and a focus on ‘big’ days
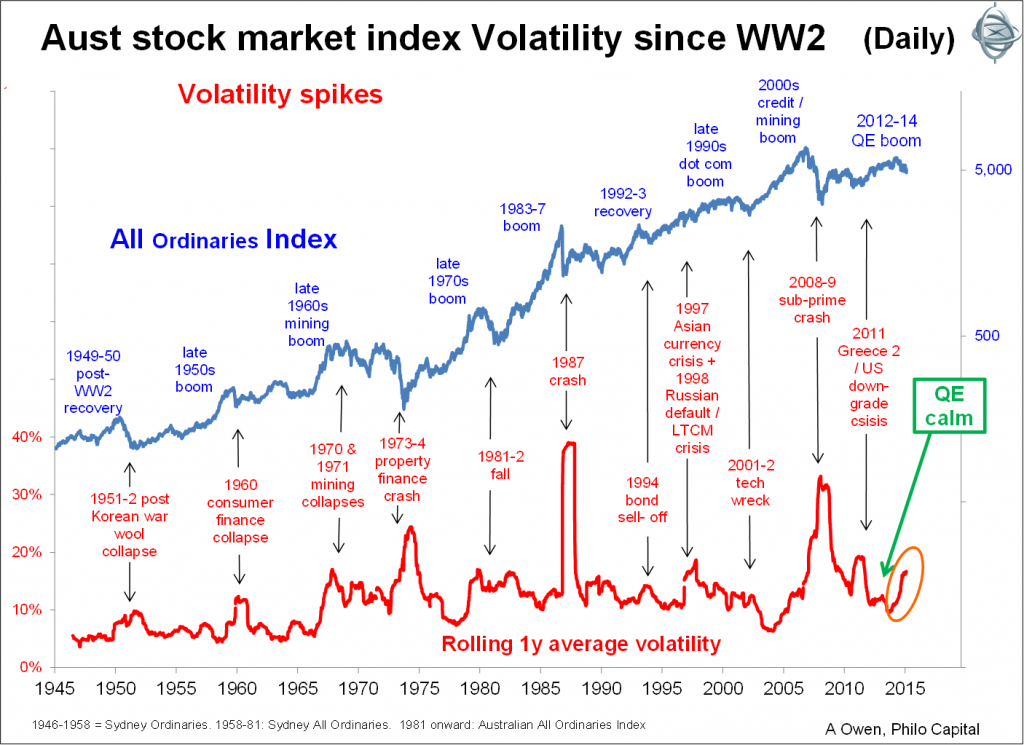
Australian shares seem to affect local investor sentiment more than any other market. The first chart shows volatility of daily changes in the market index since WW2. The red line shows the rolling 1-year annualised volatility of daily price index changes (standard deviation measure – more about this below). Here we see the recent rise in volatility from the period of QE calm.
Because the statistical ‘standard deviation’ measure is so riddled with flaws and false assumptions, I use a variety of different measures of volatility. The next chart shows the number of ‘big days’ in the Australian stock market per calendar year over the same period. I define a ‘big day’ as a move of at least 3% up or down (we could use any threshold – the patterns are the same).
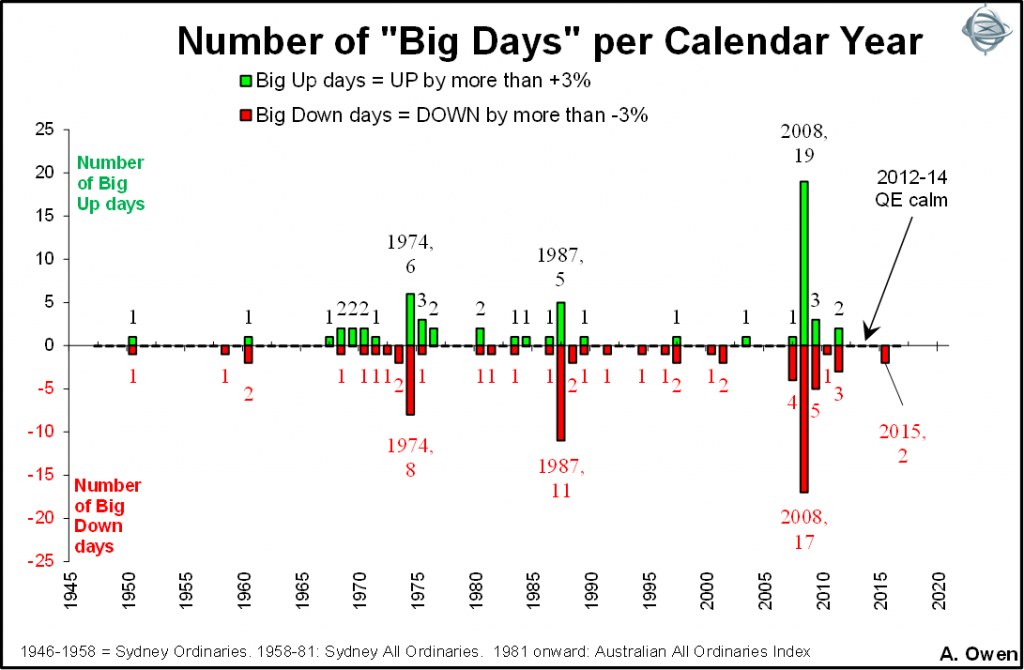
‘Big days’ are what grab media attention and tend to make investors nervous. In 2008, we had by far the most big days. It was a seemingly relentless stream of gut-wrenching days. But 2008 had more big UP days than big DOWN days, but most people only remember the bad news.
In contrast, late 2011 to mid-2015 had with no ‘big days’ at all, which is unusual. The market had not been that calm for so long since the mid-1960s. Even 2015 only had two big down days, and there have been none so far in 2016. Hardly justifies the ‘volatile’ headlines!
Other global markets repeat the pattern
We also find that other global markets have been just as calm. The chart below shows daily price volatility in seven markets since 1970: Australian shares, US shares, Australian 10 year government bond prices, US 10 year government bond prices, USD/AUD exchange rate, gold (in US dollars) and oil (West Texas Crude in US dollars).
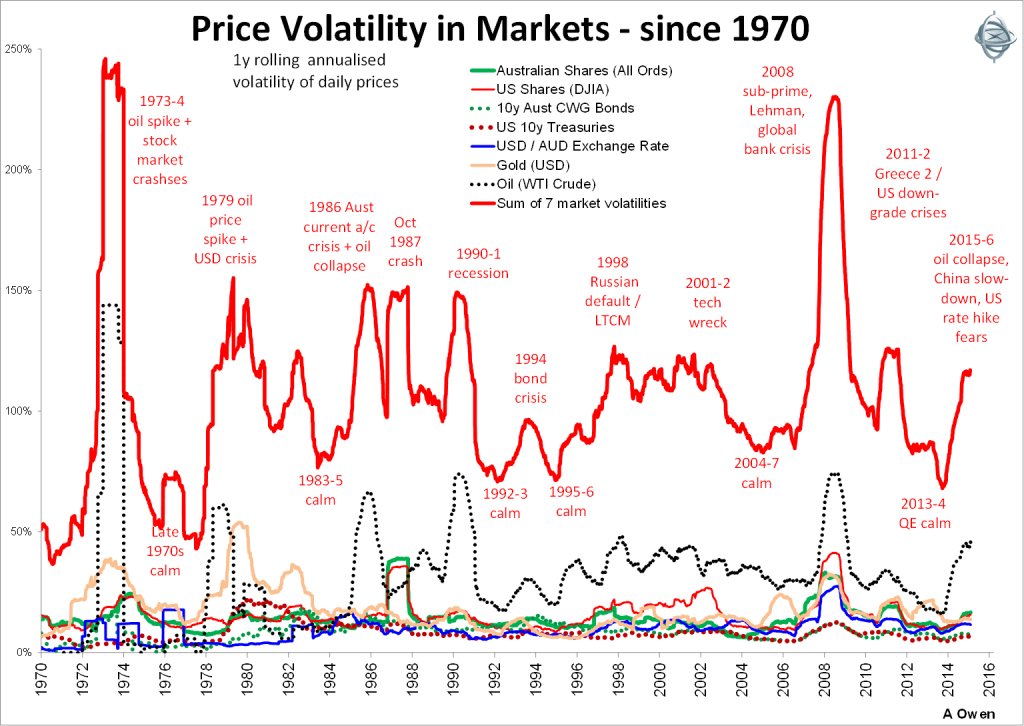
Here we see similar patterns in all markets because markets are inter-connected. The recent rise in volatility is mainly in oil prices, the rest are still relatively low.
If we take a simple sum of all the seven volatilities above we get a broad volatility index, shown as the red line on the chart.
Here we see the two ‘big ones’ – the 1973-1974 crash and the 2008-2009 sub-prime crash – and numerous other minor crises in between.
(Many people also ask about the “VIX” index. The VIX is not a measure of actual volatility – it is a mathematically flawed measure of perceived future volatility implied by an options contract over a futures contract over a market index. It can be useful for some short term traders, not investors.)
Reasons for the low volatility and recent rise
The 2012-2014 QE boom put markets, media commentators and many investors to sleep. They got used to the unusually low volatility and started to think that was ‘normal’.
The unusually low volatility was driven mainly by central banks buying up everything, regardless of quality or consequences. When US QE ended, and the Japanese and European central banks kept ramping up QE with no visible results, investors came to realise that QE doesn’t work:
- QE artificially inflates prices and creates bubbles – in bonds, shares, property
- Debt levels have kept rising – in governments and households (although the corporate sector has reduced gearing)
- Not even negative interest rates encourage spending or borrowing
- The US economy is still weak and Japan is stagnant, and it economy is dying off – literally. Europe has zombie banks and an economy dying off under crippling government debt, unaffordable welfare promises, and political gridlock.
Some general comments for investors
Investors can never afford to be complacent. Don’t assume that rising markets will rise forever, and don’t assume that falling markets will fall forever. Specifically, the QE calm gave people a false sense of security.
Don’t panic buy in booms, and don’t panic sell in busts. Specifically, investors should not interpret the recent rise in volatility as a reason to panic and make sudden decisions.
Instead, investors should stay awake, calm and vigilant at all times. Avoid market noise and stick to facts. For every loser there is a winner with risk there is opportunity. If one asset class is losing, what is winning and why? Above all, don’t be swayed by uninformed media chatter. Think for yourself and take your time.
Volatility and subsequent prices
Volatility does not ‘cause’ prices to fall. Investors should not look at a rise in volatility and think ‘prices will fall in the future’. It is the other way around: it is price falls that ‘cause’ volatility measures to rise (because price falls are generally more sudden than price rises, sharp price falls result in higher volatility measures).
Investors should not wait for prices to fall (volatility to rise) before thinking about markets, valuations and asset allocations. It is generally when prices are rising and volatility is low (the 2012-2015 QE calm) that assets become overpriced. Many investors should have reduced weight or taken profits while prices were high and volatility was low.
The recent rise in volatility (from dead calm to more moderate levels) is because prices have already fallen. There is no statistical relationship between volatility and subsequent price moves, so there is no statistical or historical basis for assuming that the recent rise in volatility means more price falls to come.
Shares have already sold off here and around the world but prices will not fall forever. Investors should not panic and abandon their strategy unless either the strategy is no longer appropriate for their needs or if their future needs have changed. Investors would only sell now if they are happy to take a loss and can re-invest in other assets with potential for better returns from current levels.
Investors should not look at volatility as any sign of future moves. My main purpose for raising it here is to add a few facts into the heated media hype about ‘volatility’ and to remind investors not to take comments about the current volatility as a reason to panic and make sudden decisions in the portfolios for the wrong reasons.
Ashley Owen (CFA, BA, LLB, LLM, Grad. Dip. App. Fin) has been an active investor since the mid-1980s, a senior executive of major global banking & finance groups, and currently advises UHNW investors and advisory groups in Australia and Asia. This article is general information and does not consider the personal circumstances of any individual.