Morningstar Global Director of Fund Research Scott Burns recently gave a presentation at the Australian Morningstar Investment Conference discussing worldwide managed fund investment trends. The following are the key findings.
Fixed income in favour
The first major trend is that despite the headlines of economic doom and gloom, worldwide managed fund assets are continuing to grow at record levels, up from approximately $US16 trillion at 31 March 2007 to approximately $US24 trillion at 31 March 2013, notwithstanding the interceding global financial crisis. Similarly, worldwide flows to managed funds also remain extremely healthy.
The strongest flows were to fixed income funds, while there have been pronounced outflows from equities funds. Over the year to 31 December 2012, for example, fixed income funds globally attracted an inflow of approximately $US535 billion, while approximately $US125 billion flowed out of equities funds.
The estimated net flow to the US Fixed Income category in 2012 of $US227 billion was three-and-a-half times greater than 2011's $US64 billion net flow. The increase was even greater in the Emerging Markets Fixed Income category, where 2012's $US60 billion net flow was more than six times greater than 2011's $US9 billion, while the High Yield Fixed Income category attracted approximately $US85 billion in 2012 ($US23 billion in 2011).
The movement of money out of equities fund categories was equally pronounced. An estimated $US38 billion flowed out of the US Equity Large Cap Growth category in 2012, on top of 2011's $US33 billion outflow. The pattern was the same in the US Mid- and Small-Cap fund categories. In the Global Equity category, there were outflows of $US25 billion in 2011 and $US17 billion in 2012. In sum, investors globally have favoured fixed income funds, despite low global bond yields, and moved decisively away from sharemarket exposures, despite recent market highs.
Biggest getting bigger and taking more of the pie
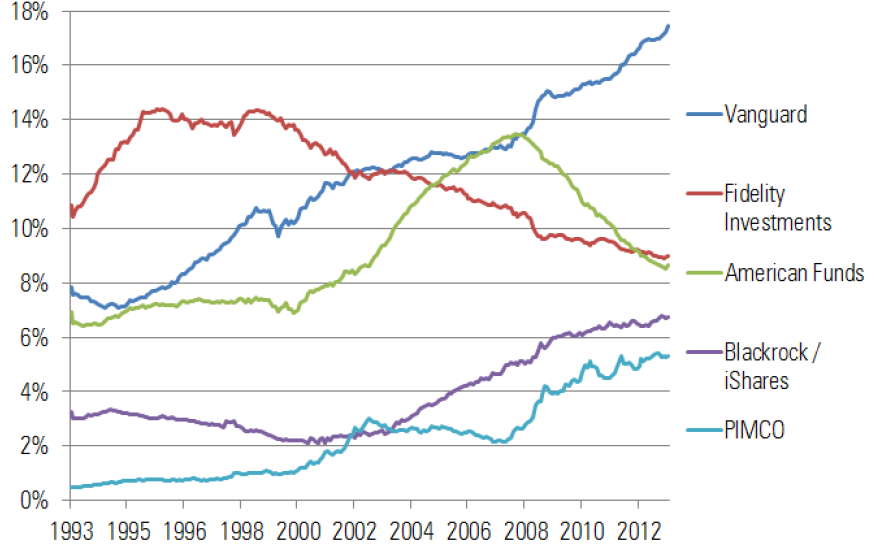
Another key development has been the establishment of a 'winner takes all' trend among global fund managers. The world's largest fund manager, index giant Vanguard, increased its share of global managed fund assets from 9.27% ($US1.36 trillion) at 31 December 2011 to 9.62% ($US1.62 trillion) at 31 December 2012. PIMCO's share over the same period increased from 3.67% to 4.18% (from $US540 billion to $US707 billion). These two fund managers together accounted for a third of all managed fund inflows globally over the year to 31 December 2012, significantly outpacing their rivals among the world's largest fund managers.
Vanguard and PIMCO have over the past 20 years consistently increased their portions of the global managed funds pie. Vanguard's share of world managed fund assets has grown from just under 8% in 1993 to almost 18% in 2012, and PIMCO has grown from under 1% to over 5%. Fidelity's share of global fund assets has fallen from over 14% in 1995 to 9% in 2012.
The rise of the passive fund
Arguably the most significant development in the worldwide funds industry has been the surge since the onset of the global financial crisis in assets being invested in passive over actively-managed offerings.
In 2007, approximately $US220 billion was directed into index funds and approximately $US880 billion into actively-managed vehicles. In 2010, however, the approximately $US250 billion investment into index funds was more than three times the $US80 billion placed into active funds, while in 2011, just over $US200 billion was invested in index funds, while there was an outflow of about $US100 billion from active managed fund categories.
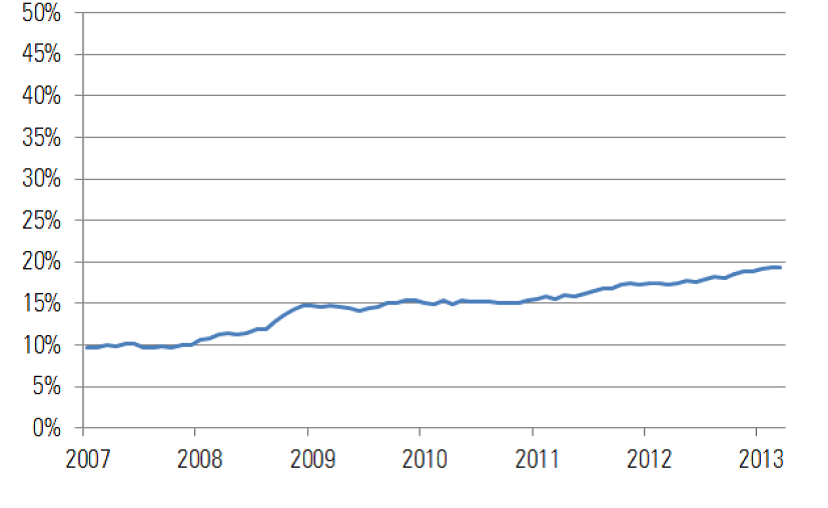
Index funds are also steadily gaining ground in terms of share of global managed fund assets – among non-US-domiciled equities funds, for example, index vehicles have increased their share of total assets from just under 10% in 2007 to just under 20% by 2013, as shown below.
Non-US-domiciled index funds share of total managed fund assets has doubled since 2007
Looking across the world regions, indexing is gaining share everywhere except Australia and New Zealand. In 2012, this was the only region to experience a small outflow from index funds. In Asia, index funds' estimated net flow of $US16 billion in 2012 was more than twice the $US7 billion attracted by active funds. This was echoed in Europe, where index funds took in $US23 billion ($US17 billion for active funds), and in the United States ($US259 billion estimated net flow to index funds in 2012 over $US203 billion to active funds).
A noticeably lower proportion of Oceania's managed fund assets is invested in index strategies than is the case in a number of other world regions. Passively-managed assets accounted for 24% of US and 22% of Asian managed fund assets at 31 December 2012, for example, but only 8% of fund assets in Australia and New Zealand.
Other noteworthy investing developments have included moves to incorporate alternative assets into investment portfolios; a shift to more active asset allocation at the overall portfolio level, but with greater use of passively-managed underlying asset class exposures; and a focus on ensuring that active management is truly active – investors are not prepared to pay alpha prices for beta.
Shift away from fund commissions
Another major global trend is legislative and regulatory intervention away from fund commission payments. Australia's Future of Financial Advice reforms mirror developments elsewhere – for instance, the Dutch financial services regulator has banned fund commissions effective from 1 January 2014. In the United States, the proverbial 'invisible hand' of the market is driving commissions towards extinction – the percentage of managed fund assets with loads (commissions) has fallen from around 53% in 1993 to under 30% by 2013.
There are also wider moves towards pan-European managed fund regulation as part of the European Union's Markets in Financial Instruments Directive (MIFID), which aims to harmonise regulation for investment services and increase competition and consumer protection across the EU's 30 member states.
The outcome of this regulatory change has in a number of cases been significant falls in the fees investors pay. Following the Retail Distribution Review in the United Kingdom, for example, the cost of British share funds has on average fallen from 150 to 75 basis points.
Summary of global trends
In summary, the key global managed fund investment trends are continuing asset growth and healthy worldwide flows; a pronounced shift in preference for index over actively-managed funds; the largest fund managers increasing their share of overall managed fund assets; and regulatory moves away from fund commissions. Investors should benefit from resulting greater economies of scale, greater transparency, and lower fees. Australia remains unusual by world standards in our comparatively low share of indexed assets as a proportion of total managed fund investments, and continuing preference for equities over fixed income.