Register For Our Mailing List

Register to receive our free weekly newsletter including editorials.

Home / 621

100 Aussies: seven charts on who earns, pays, and owns

The Labor government seems intent on introducing its $3 million super tax as well as investigating broader tax reform to boost our flatlining economy. Before pushing through with changes, it’s critical to recognize who pays the bills and who owns the assets.

That’s where the Australian Taxation Office’s annual snapshot of individual tax returns is useful. Because not everyone lodges their returns on time, the latest data are from the 2022-2023 financial year, though they offer fascinating details, nonetheless.

The snapshot reveals around 16.1 million individuals lodged tax returns in 2023.

Breaking it down by generations, for every 100 Australians lodging returns:

  • 18 are from Generation Z (born between 1996 and 2009)
  • 35 are from Generation Y (born between 1980 and 1995)
  • 29 are from Generation X (born between 1963 and 1979)
  • 15 are Baby Boomers (born between 1946 and 1962)
  • 3 are from the Silent Generation (born in or before 1945)

So, 82% of taxpayers are younger than Baby Boomers.

Of the 100 people, 72 received a tax refund, 21 owed tax and 7 were perfectly balanced. Just 9 declared a capital gain, while 14 earned rental income (7 with losses and 7 with profits). Meantime, the proportion of men and women who lodged returns were split 50:50, and 77 came from states on the east coast.

Let’s look further at the key points from the taxpayer snapshot.

1. Who pays tax?

Australia has a progressive tax system where the more you earn, the more tax you pay. Most consider it a fair and equitable way for those with resources to provide for those without.

Nevertheless, the data on the gap between high- and low-income earners surprised me. Just 15% of Australians have an annual salary of $120,000 or more. And more than 40% earn less than $45,000 a year.

That 40% of taxpayers pay just 3% of the total tax tab. Meanwhile, the 15% earning more than $120,000 accounts for 68% of the net tax collected by the ATO.

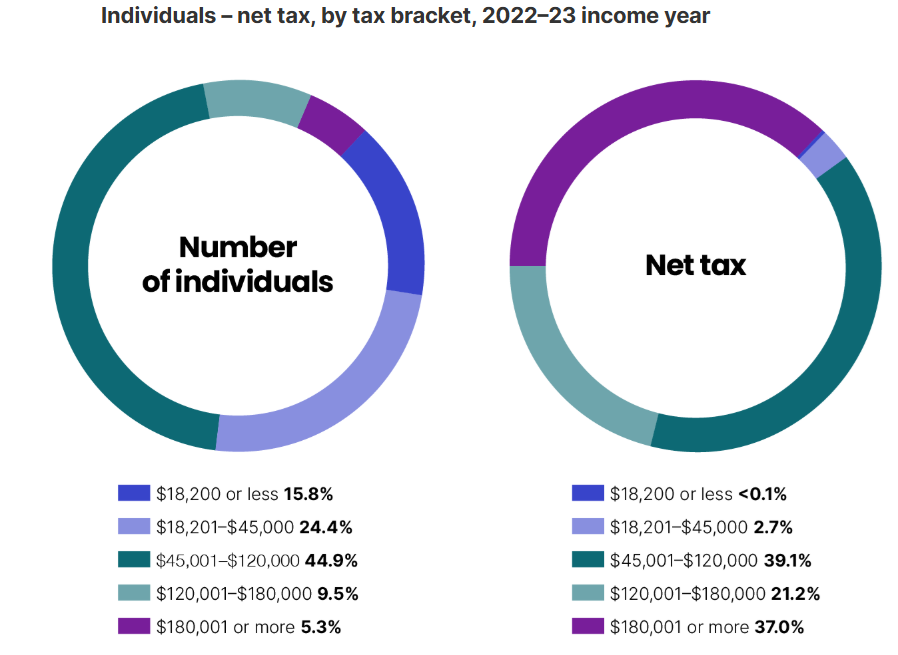
The ATO breaks it down further by ranking the 100 people by taxable income:

  • The top 3 paid 29% of all net tax
  • The next 6 paid 18% of all net tax
  • The next 30 paid 40% of all net tax
  • The next 35 paid 13% of all net tax
  • The final 21 paid no tax

2. Taxable incomes

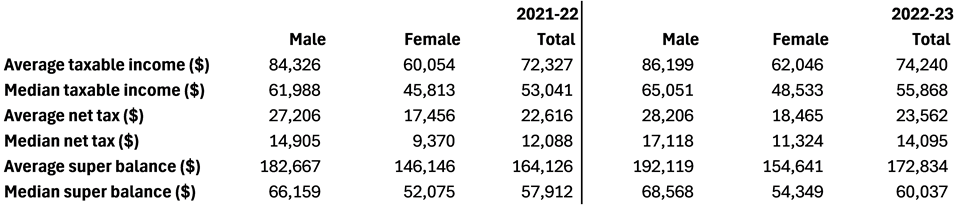
For the 2023 financial year, the average taxable income was $74,000. Averages can be deceiving, so it’s often better to look at median incomes. And on this front, the median wage was $56,000. Put another way, 50% of Australians earn less than $56,000 a year.

There still seems a large gap between pay for men and women. The median salary for men is around $65,000 while for women, it’s less than $49,000. This doesn’t consider the proportion of men and women that are working full-time versus part-time or casual.

Finally, the average superannuation balance is close to $173,000. However, the median balance is only $60,000.

3. Top taxpayers by postcode

Let’s turn to the top end of town and the top 10 postcodes by average income. NSW has 7 of the leading postcodes, Victoria 2 and Western Australia 1 (the ATO chart below mistakenly places Cottesloe and Peppermint Grove in NSW instead of WA).

Individuals – top 10 postcodes, by average taxable income, 2022–23 income year

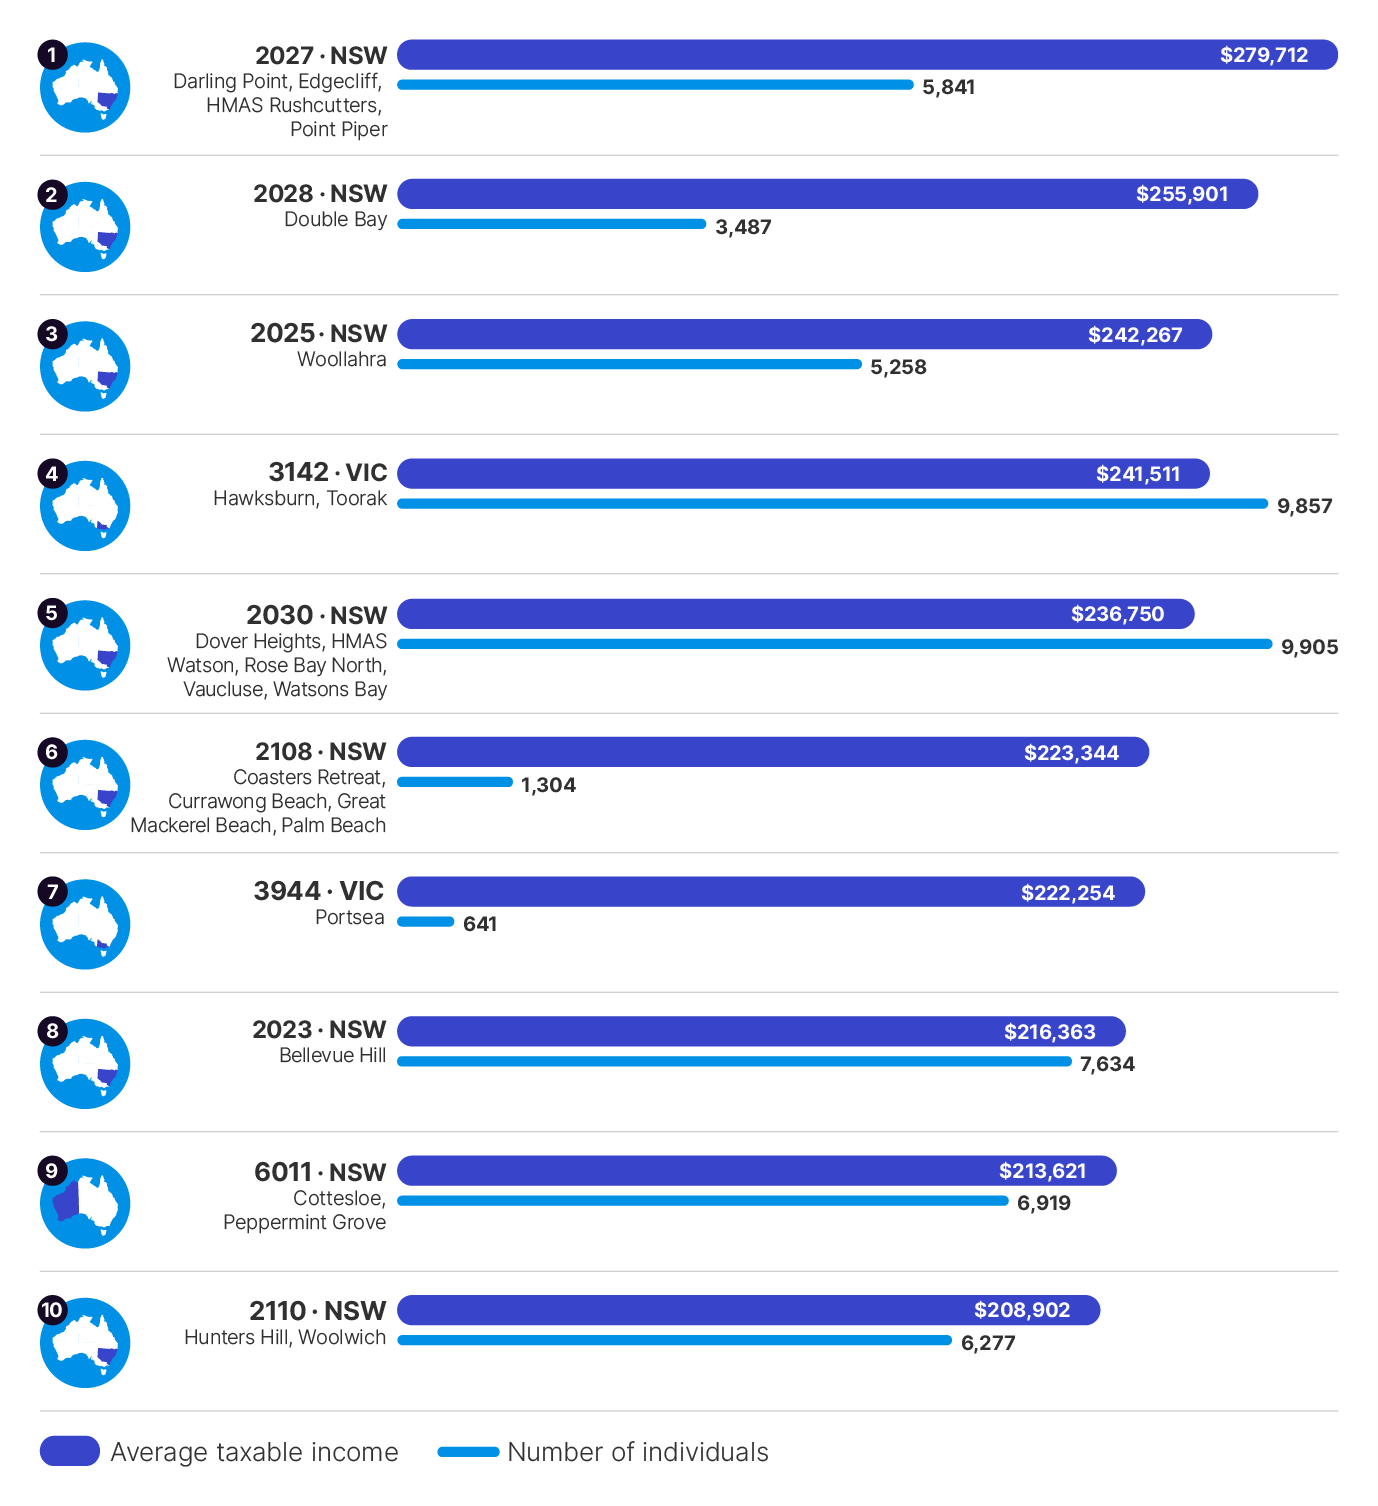
It isn’t a surprise to see Sydney’s eastern suburbs occupy four of the top five spots. The likes of Darling Point and Point Piper have average wages of $279,000, a reasonable way ahead of Double Bay in second place.

People in Hawksburn and Toorak in Melbourne have average salaries of $242,000.

Meantime, WA’s only entrants, Cottesloe and Peppermint Grove, have average wages of $214,000.

4. Top taxpayers by occupation

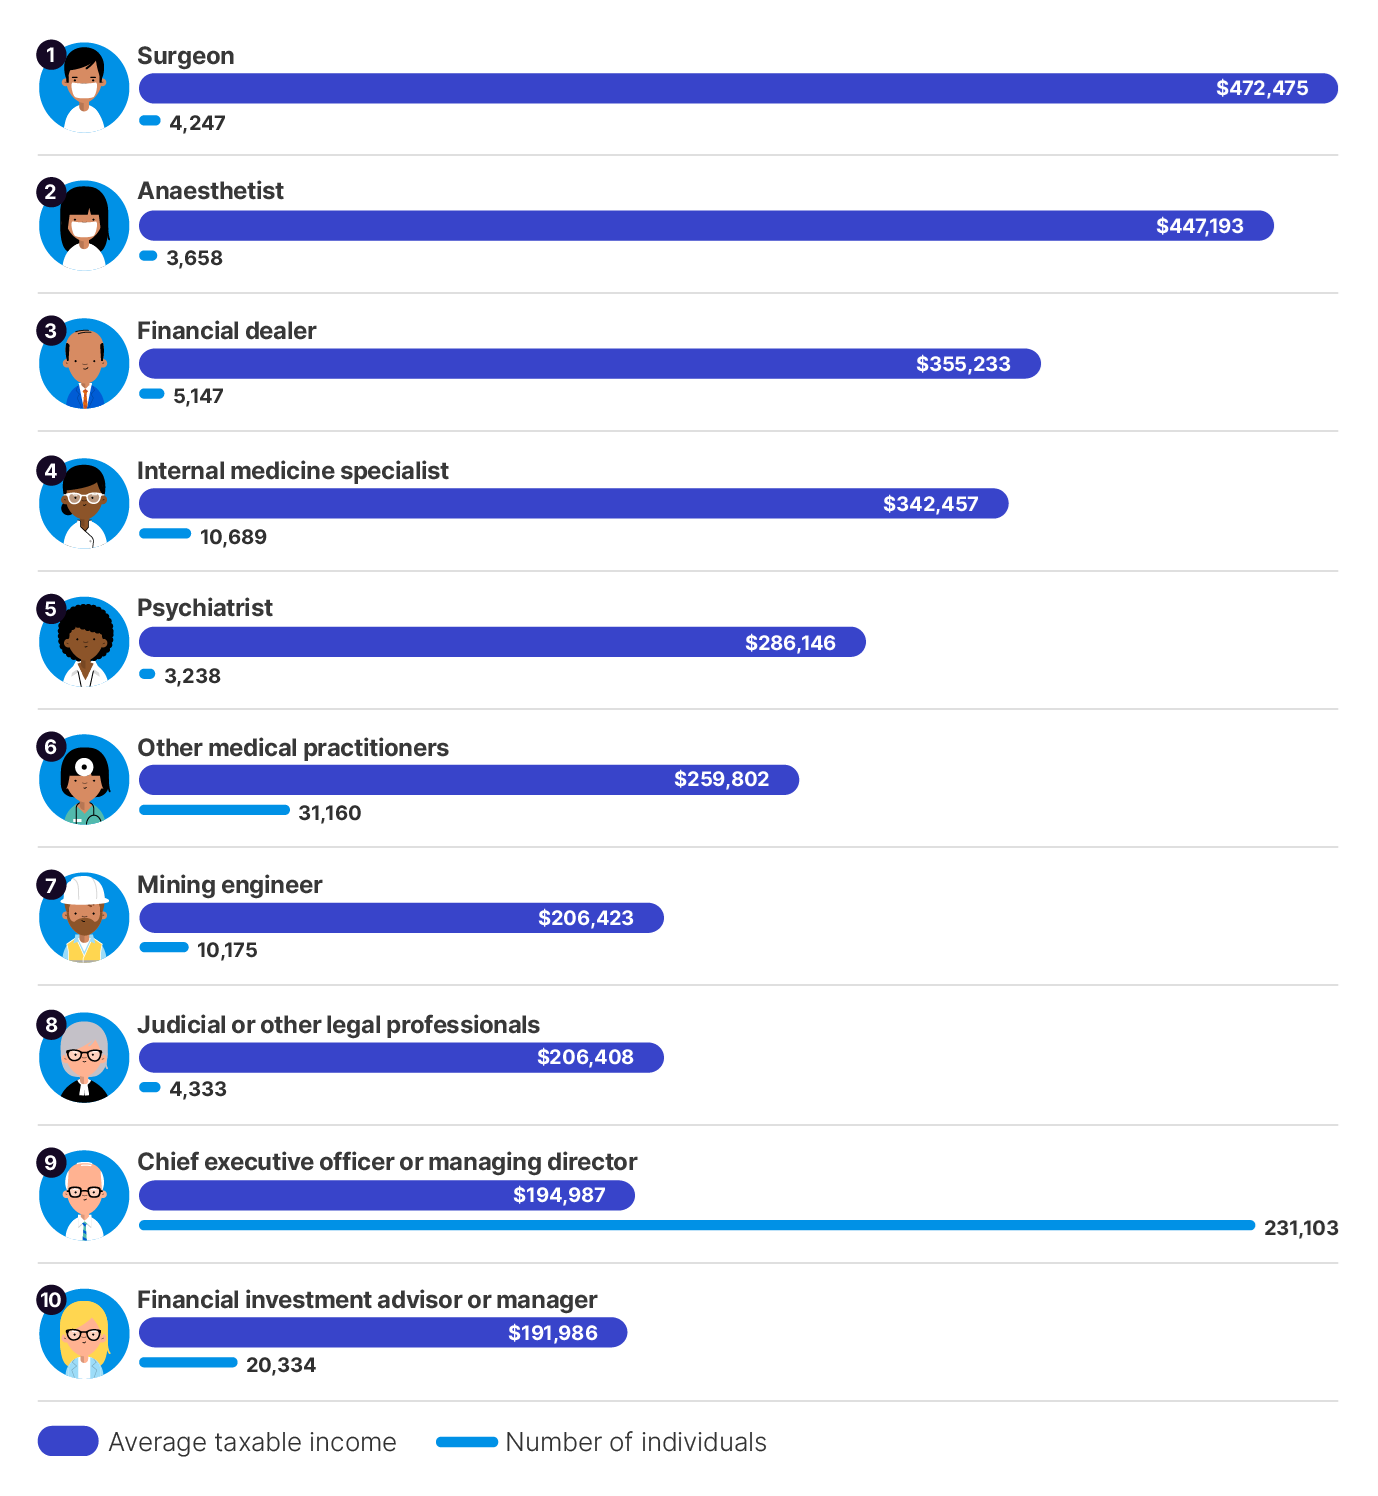
Unsurprisingly, the medical field dominates the leading taxpayers by profession. Surgeons top the list for average incomes, followed by anesthetists. Interestingly, anesthetists earn the most on a median basis ($425,000 vs $366,000 for surgeons). This indicates that top surgeons earn a lot more than less experienced surgeons, whereas it's a flatter playing field for anesthetists.

The number of people in leading medical professions is relatively low. Greater numbers of top-earning individuals are found in the occupations of CEO/MD and financial adviser/manager.

Having 231,000 as Chief Executives or Managing Directors seems like a lot, though it’s only about 1.4% of total taxpayers.

Individuals – top 10 occupations, by average taxable income, 2022–23 income year

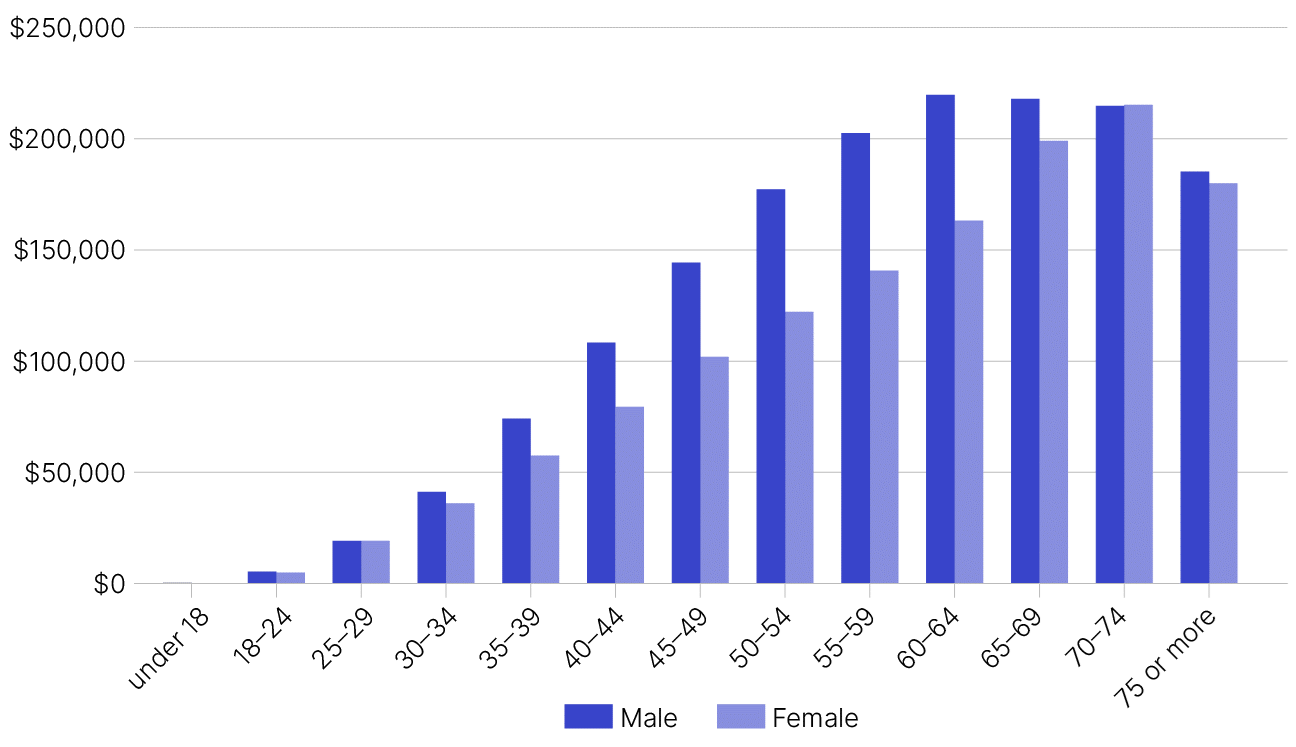
5. Average super balances by age

As mentioned, the median super balance is $60,000. Naturally, older people hold more super.

The largest super balances belong to 60-64-year-old men, at $219,000. Obviously super balances decrease beyond that age as retirees draw down their super.

However, for women, the bigger super balances belong to those aged 70-74. Whether this is due to spouses departing, I am not entirely sure.

Superannuation balances for men and women

6. Who owns investment properties?

Moving onto who owns our assets.

Residential property is the largest asset class by far, valued at around $11 trillion, and most Australians have their wealth tied up in real estate.

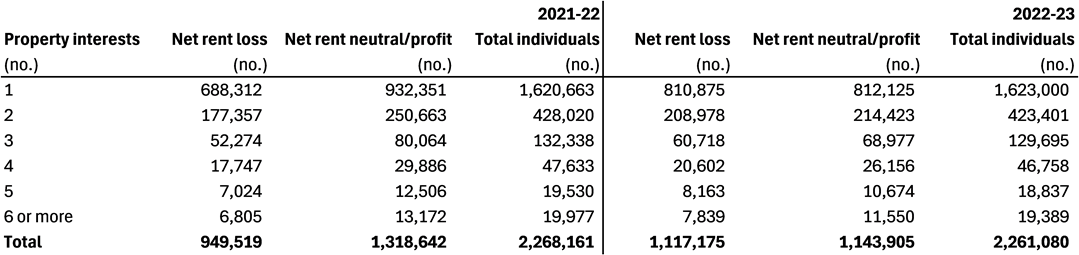
The ATO data shows that 2.26 million Australians own investment property, or 14% of all taxpayers. Of these, more than 1.6 million have just one investment property. And almost 215,000 own three investment properties or more.

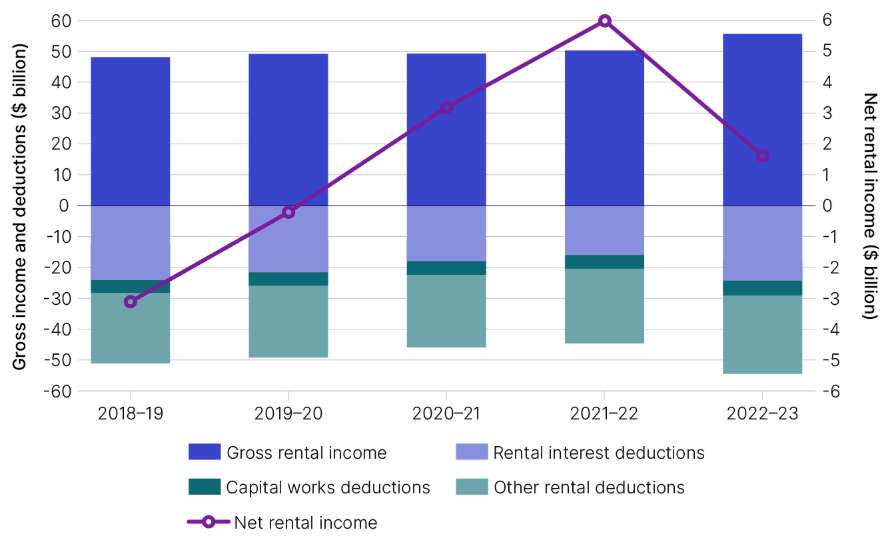
Australia’s property landlords get more than $56 billion in gross income from renters. That’s significantly more than the $49 billion collected two years prior (thank you, rental inflation post Covid).

However, after mortgage interest and other deductions, investment property owners only earned $1.6 billion in net income. Albeit, that’s better than the net losses from 2018 to 2020 when Covid-related rental assistance impacted landlords.

Individuals – rental income and deductions, 2018-19 to 2022-23 income

One takeaway

There are different ways to interpret this ATO data. My takeaway is that there are a relatively small group of people who earn the most, own the most, and pay the bulk of the taxes, and a much greater group that struggles to make ends meet and pays little to no tax.

Our system requires a delicate balance of taxing the well-off in a fair and equitable way to help the less fortunate. The art for policymakers is doing this in a way that doesn't discourage the accumulate of income and wealth, and also encourages mobility up the income ladder.

* Thanks to Firstlinks’ subscriber, Bill, who requested an update to Graham Hand’s 2021 article, 100 Aussies: five charts on who earns, pays and owns.


James Gruber is Editor of Firstlinks.


36 Comments
David M
July 27, 2025

I think in Australia we need to have a conversation around taxing income versus taxing assets. The reality is I pay 47% tax on my income, and this only leaves me 53% of my income to save and create assets/savings. Compared to the person who will inherit properties and other assets tax free, this creates a social divide between those who inherit and those who don't.
Further, I have clients who are retired who generated tax free income last year of $500,000 paying no tax at all, with an asset base of $7m in property, shares and super. The same individual would pay $200,000 in tax. This inequity will only get worse as the population ages. I know many people reading this will have paid lots of tax to generate their savings and will fill hard done by my comments, but the current system doesn't work - we need to suck it up and make changes, but I fear we will just target high income workers, which will inevitably mean inheritance is the onlyw ay to prosperity in this country.

James#
July 27, 2025

"I think in Australia we need to have a conversation around taxing income versus taxing assets"

Yes, but an unbiased, non-partisan, non-cherry picked conversation thanks Mr Chalmers! Funny, Ken Henry produced a comprehensive document over 15 years ago to completely reform taxation and the Rudd-Gillard governments didn't want to touch it!

The other adult conversation needs to be government being reminded of the social compact and responsibility of not wasting tax payer money! Programs like the NDIS need to be brought under control, not just pretending to do something. Massive public service and bureaucracy for our population size. The renewable, "cheap" energy fantasy which will cost Trillions. And as for Albo's legacy plan of universal childcare for all, paying just $10 per day, we can't afford this sort of extravagance.

Unless spending is brought under control, more revenue generated from more taxes won't solve the problem. We have a spending problem first and foremost.

Jack
July 27, 2025

James,

Spending has nothing to do with the crazy housing bubble we've built.

Go after that first.

Jim Kiernan
July 27, 2025

Australia has the 29th highest total tax of all OECD countries (that is all tax, not income tax). To be clear, that means 28 other countries (in the OECD) have a higher total tax. The 15% of income earners who pay about half the total tax in Australia have ways of avoiding tax if they want to go down that road.

James
July 27, 2025

The numbers on medical practitioners -- can be miss leading. It does not take into account hours worked.
People like GP's, surgeons ,etc do not 38 hour weeks.
It is impossible to work just 38 hours per week even if you did not want to work the hours we did. How do you say to a patient "Sorry will not attend to you I have done my 38 or 40 hours this week".
The bulk of my working life I was paying 50% of my wage in taxes -- now retired for 6 years. However the tax regime was different then and I will admit more generous when it came to deductions for tax. Over the yrs post Keating the deductions became less generous, basically tax remained the same and I started to work less hours ( did not see the value of working hard and losing 50% of the extra money I was earning).
Recently returned from Sweden and Norway. Personal tax rate highest was around 55% and there are high indirect taxes e.g. 25% GST. The welfare system is different and more inclusive.

Mon
July 28, 2025

Totally agree … the stats do not report the truth.

Michael
July 27, 2025

Post code 6011 is not in NSW. Fix it.

James Gruber
July 27, 2025

Michael,

Read the article again because I mention the error in the chart, and they got the state wrong not the postcode. And I can't fix it because it's an ABS chart, not mine.

Dauf
July 27, 2025

I’d expect that once you account for social welfare (power subsidies, Family tax benefits, rent assistance …the list goes on), the proportion of people paying no net tax (or next to no tax, will be even higher. I still love the old tax policy explained in beer analogy…it doesnt end well.

But keep bringing in people hat the nation does not end and they will keep voting for these clown and the young will eventually end up paying for their own silly voting patterns…or there may of course be a generational punishment for anyone who saved by the remaining jealous and envious

michael
July 27, 2025

I have long thought the fairest way to decrease income tax is to raise the tax free threshold. Everybody gets the same dollars, but it means more to the paupers.

Vee
July 26, 2025

The real issue here is a government spending issue. That needs to be cleaned up first before reviewing major changes to taxation.
These statistics can be skewed to paint the picture the government wants. It is still clear that most pay little or no tax and are reliant on a few, who pay most taxes already by far The government and agencies gloss over this, and keep looking at the top payers and how to squeeze ever increasingly more from them to feed the machine. The modern wealthy have become today's slaves to the majority of individuals.

GeorgeB
July 26, 2025

You have exactly understood the problem, although the challenge facing the nation is to have the half of the population that benefits from government money or in other words from the efforts of the other half of the population that actually creates the wealth, to fully appreciate the scale of the problem. It is patently obvious to anyone with half a brain that the government already has an agenda (leaked via less than competent treasury official) to squeeze more tax from the usual suspects while the so called round table discussion is merely a convenient smoke screen to deflect blame when that reality is dropped on the nation at large.

Vee
July 27, 2025

Yes. And BTW, I believe that the accidental release of that document was quite deliberate with Chalners' full knowledge. He is very happy for these summits and public discussions. Its part of the perpetuity of the Robin Hood mentality. However, that no longer holds true and I read recently that more than half now get most of their income from the government courtesy of the "wealthy slaves". This is very possibly true, given that most people overall are tax positive and pay far less tax than they benefit from in the form of pensions, handouts etc.

James.
July 27, 2025

I agree. The big problem Australia has, is that we have a Socialist government that is incompetent and has no other agenda, other than to keep themselves in a job and keep their respective noses in the trough. Albanese and Co, couldn't give two hoots about improving the well being of Australians. all they want is to keep getting the big salaries and bigger perks and to make themselves look like heroes. Wouldn't P1ss on any of them if they were on fire.
They waste so much of the money they take off the people, that it is nothing short of criminal.

ACT ratepayer
July 26, 2025

"Australia has a progressive tax system where the more you earn, the more tax you pay."
Well sounds good but not exactly true.
The GST is a regressive tax that is a flat 10% on everyone. So the less you earn the greater the proportion of your after income tax disposable earnings you pay.
Rates on unimproved land values are also a regressive tax because they are applied irrespective of what you earn or your capacity to pay. Just because you are a pensioner or average earner whose land has seen major increases in assessed value doesn't mean you have the same capacity to pay as the millionaire living next door on the same sized and same valued property.
Here in the ACT rates have risen 30% in the last five years, far in excess of inflation and wages. Rates have more than tripled since 2012. Many retirees and average income earners in older suburbs are now being taxed close to $10,000 a year in rates on their land value, whether the block has a new mansion or an original weatherboard. Rates are a tax on unrealised capital gains and I dispute that such a tax is 'progressive'. Home owners can't just sell part of their house or part of their household block to pay these ever increasing exorbitant rates.

Richard
July 26, 2025

I would like to know how much tax we pay over a year considering property tax, GST, car rego, stamp duties, etc and income tax.

Harry
July 25, 2025

Average incomes quoted in articles, whether in financial literature, General media or otherwise are always pure fiction. When the bits we know for a fact are so off piste, we can only be sceptical about the accuracy of the rest. !

DarylS
July 25, 2025

If someone has a high taxable income (say $200k and up) you can bet that their gross was initially much higher. Long retired, I was on a reasonably high income, yet quite legally cut it in half for the ATO.

GeorgeB
July 25, 2025

"I was on a reasonably high income, yet quite legally cut it in half for the ATO. "

I was also on a reasonably high income for most of my career but didn't need to cut it in half because the ATO did it for me by taxing 42% of everything I earned (GST and other taxes likely took it to at least 50%).

Kevin
July 26, 2025

Nah. I get a bill every quarter,what was called provisional tax.The franking credits don't cover the tax that should be paid on the gross income. The current one is payable by 28 July.I paid it last week . 6 figures a year in tax,no pension ,no CSHC card or whatever it's called.I'm still a bit disappointed that I'll never make it to paying 7 figures a year in tax.

Brett
July 27, 2025

Please tell us how to cut taxable income so we can learn to do the same!

Wildcat
July 25, 2025

We need to move away from income tax. Get it from over 60% off tax receipts to the OECD average of 34%. Increase the gst, broaden the base (compensate bottom 20%), remove refundable franking credits, drop Div 296 to $2m, index it and remove tax on unrealised gains. Then the country will be fairer. Won’t happen of course.

Then we might have a fairer system.

Dudley
July 25, 2025

"Then we might have a fairer system.":

'Fairer' for those with large incomes and small expenses, for whom only flat tax would be 'fairer'.
'Fairer' if those with small incomes and large expenses toughened up.

Wildcat
July 25, 2025

As I said compensate the bottom 20%. What about that is not clear to you

Dudley
July 25, 2025

"As I said compensate the bottom 20%.":

They are already compensated by receiving more in welfare than they pay in tax and pay no GST on food; effectively paying them to eat.

"remove refundable franking credits":
Taxing "the bottom 20%" at 30% on their dividends would be 'fair' considering their food would be 'free'.

Paul
July 25, 2025

Also of interest would be the overall income including all social benefits attributable to each of the above cohorts. That would present a better overall picture of the fairness or otherwise of the whole system. In addition, earnings by gender and profession, adjusted for hours worked per annum, if it were possible somehow, would be very interesting.

Vee
July 26, 2025

I've always wanted to know this.
Add in all government benefits and then calculate the % of tax paid and then let's see what is actually equitable.
I am of the opinion that the current wealthy are now the "slaves" of the 21st Century, with the majority of that small cohort paying to keep non-workers and low income workers fed and housed, more so that they dont have to work if they choose not to. Think about that with an open mind.
I fail to understand that 50% of our population earns most of their income from the government (aka tax payer) handouts. There cannot possibly be so many people needing assistance. Most are able minded and bodied, surely.

Luke
July 27, 2025

Agree with you Vee. As someone who's a self employed farmer, we are the slaves of the 21st century. Often selling goods at below our cost of production. b98% of the total wealth generated by us is from capital gains, the other 2% from cashflow. When the day comes to sell the farm, I'm looking for every cgt discount and tax deduction available. Wages are too high, we compete with other industries for workers.
I enjoy farming, but buying a farm and paying it off is almost impossible. With current lamb prices, it's become a bit easier, but ppl are moving out of sheep farming in droves due to the economic fundamentals. In the end farming is a large property investment portfolio, you work your balance sheet through leverage and try to build off farm wealth. The cash payday happens once you sell up.

Beamer
July 25, 2025

the 15% earning more than $120,000 accounts for 68% of the net tax collected by the ATO.

This shows just how unfair our tax system is, hence I'm looking for every loophole there is to minimise tax.

Luke
July 25, 2025

Beamer, I think it should read 58%, adding the numbers in the charts. Not quite so "unfair" as if it was 68%, then.

James Gruber
July 24, 2025

CC,

Re CEOs, my guess that it includes all the small businesses with CEOs/MDs. If right, the figure would make more sense.

On anaesthetists, yes, it does seem low.

Dudley
July 24, 2025

I'm MD. My taxable income is less than my tax free threshold, which is less than my non-taxable income.

Dudley
July 24, 2025

My "non-taxable income" is actually not income, it is capital withdrawn from Super.

CC
July 24, 2025

There must be a lot of very clever accounting going on if you think the average CEO earns less than $200K....
I also know for a fact that full time Anaesthetists and other Medical specialists make more than stated there, so perhaps the figures include part timers

davidy
July 24, 2025

The above number of CEOs is 231,000 so that includes a lot of people outside the ASX 200, hence the 'average' income of $195k

Greg
July 26, 2025

I suspect the medico's have a few deductions from gross income to get to those taxable income averages, and some cleverly rigged accounting ploys to help with structures too.


Leave a Comment:

RELATED ARTICLES

The fetish for lower taxes has gone too far

Labor had no choice on stage 3 tax cuts

Meg on SMSFs: negative earnings and the $3 million tax

banner

Most viewed in recent weeks

Raising the GST to 15%

Treasurer Jim Chalmers aims to tackle tax reform but faces challenges. Previous reviews struggled due to political sensitivities, highlighting the need for comprehensive and politically feasible change.

7 examples of how the new super tax will be calculated

You've no doubt heard about Division 296. These case studies show what people at various levels above the $3 million threshold might need to pay the ATO, with examples ranging from under $500 to more than $35,000.

Are franking credits hurting Australia’s economy?

Business investment and per capita GDP have languished over the past decade and the Labor Government is conducting inquiries to find out why. Franking credits should be part of the debate about our stalling economy.

Here's what should replace the $3 million super tax

With Div. 296 looming, is there a smarter way to tax superannuation? This proposes a fairer, income-linked alternative that respects compounding, ensures predictability, and avoids taxing unrealised capital gains. 

The rubbery numbers behind super tax concessions

In selling the super tax, Labor has repeated Treasury claims of there being $50 billion in super tax concessions annually, mostly flowing to high-income earners. This figure is vastly overstated.

9 winning investment strategies

There are many ways to invest in stocks, but some strategies are more effective than others. Here are nine tried and tested investment approaches - choosing one of these can improve your chances of reaching your financial goals.

Latest Updates

Taxation

100 Aussies: seven charts on who earns, pays, and owns

The Labor government is talking up tax reform to lift Australia’s ailing economic growth. Before any changes are made, it’s important to know who pays tax, who owns assets, and how much people have in their super for retirement.

7 key charts on the state of the Australian property market

The Australian property market stirs fierce debate - often bullish optimism versus crash predictions. But beyond the noise, seven charts reveal what's really driving prices and the outlook for residential real estate.

A simple alternative to the $3 million super tax

Division 296 aims to introduce improved fairness into the superannuation system, yet is overly complex. This scours the world for better ideas and suggests a simpler alternative which can achieve the same goals.

CBA and the index conundrum for super funds

After the hyperbolic rise in CBA shares, super funds are floating the idea of carving out the weightings of ASX bank securities and indexing them within their portfolios. This looks at why that might be a big error.

Strategy

10 policies to drive Australian productivity higher

Here's a comprehensive list of proposed reforms to fix Australia's stagnating economy, including introducing a flat income tax rate, reducing migration, and making childcare tax-deductible.

Interviews

Where to find big winners in Asia

As more money looks for a home outside the US, Asia may soon get some love. Fidelity's Anthony Srom outlines the best places in Asia to invest, including in Chinese consumer names, Indian financials, and Thailand.

Investment strategies

We have trouble understanding the time value of money

We overvalue the present and underestimate the future - it’s a cognitive glitch called hyperbolic discounting. It affects savings, spending, and loans, and it's more common - and costly - than we think. 

Sponsors

Alliances

© 2025 Morningstar, Inc. All rights reserved.

Disclaimer
The data, research and opinions provided here are for information purposes; are not an offer to buy or sell a security; and are not warranted to be correct, complete or accurate. Morningstar, its affiliates, and third-party content providers are not responsible for any investment decisions, damages or losses resulting from, or related to, the data and analyses or their use. To the extent any content is general advice, it has been prepared for clients of Morningstar Australasia Pty Ltd (ABN: 95 090 665 544, AFSL: 240892), without reference to your financial objectives, situation or needs. For more information refer to our Financial Services Guide. You should consider the advice in light of these matters and if applicable, the relevant Product Disclosure Statement before making any decision to invest. Past performance does not necessarily indicate a financial product’s future performance. To obtain advice tailored to your situation, contact a professional financial adviser. Articles are current as at date of publication.
This website contains information and opinions provided by third parties. Inclusion of this information does not necessarily represent Morningstar’s positions, strategies or opinions and should not be considered an endorsement by Morningstar.