The current housing figures have been remarkably resilient given the circumstances, as house prices in Australia have fallen by 1.6% nationally in the three months to end July, according to CoreLogic. This is occurring through some of the worst economic conditions the country has seen in the past 70 years. Most forecasts suggest there will be more declines but of a magnitude that is similar to 2019.
This article focuses on the short-term indicators to help determine if this relatively benign outlook should hold. The following article, Part 2, then examines the longer-term drivers.
Chart 1: Australian house price index
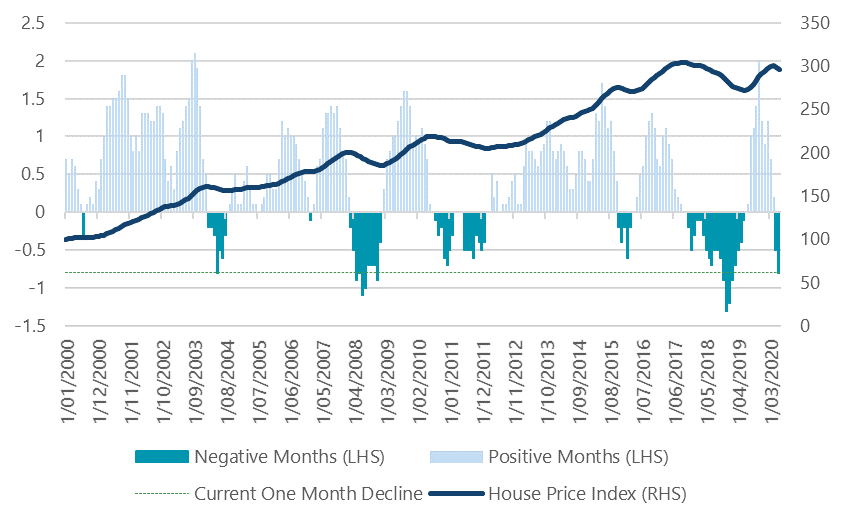
Source: Bloomberg, CoreLogic, Nikko AM
Short-term forward indicators: the usual suspects
Three key indicators are particularly useful for the short-term outlook:
1. Auction clearance rates
When the Australian economy was in total lockdown during April 2020, auction clearance rates plummeted. They have since recovered into the mid-60% range, however weak outcomes persist in Victoria. From a historical perspective, this would imply house price outcomes are slightly better than the declines seen in 2010 or 2018, making prices flat when compared to this time last year. To end up flat year-on-year over the next few months, we would need to see a 5% fall in prices to offset the late 2019 strength.
Chart 2: Auction clearance rates and house prices
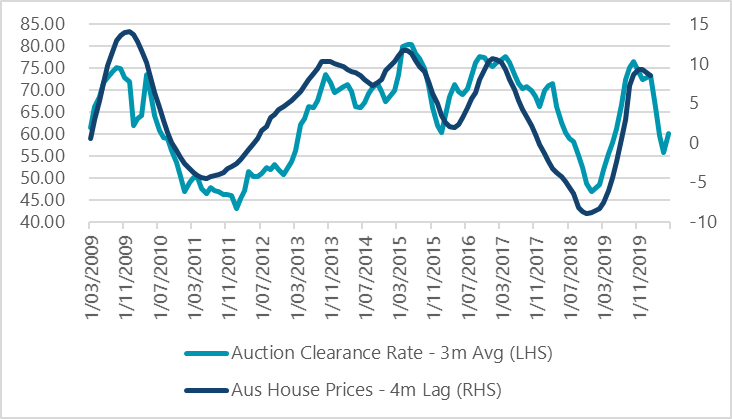
Source: Bloomberg, Nikko AM
2. Mortgage finance
The most recent data point for mortgage finance is from May 2020, which was highly affected by the lockdown, but nevertheless showed some of the largest declines in finance of the past 20 years. This paints a bleaker picture than the auction clearance rates, with prices pointing slightly negative year-on-year. Mortgage finance has fallen from its lofty levels during late 2019 and we expect this should weigh on prices, potentially in the 5 to 10% range over the next few months.
Chart 3: Mortgage finance and house prices
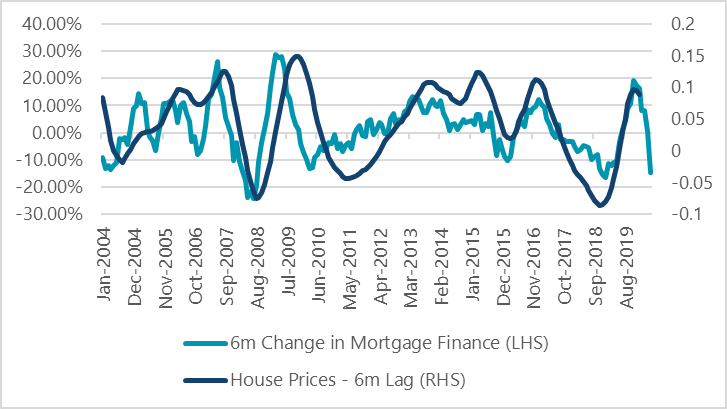
Source: Bloomberg, Nikko AM
3. Building permits for new homes
This indicator typically moves in the same manner as house prices. The most recent figures for building permits show there’s been a quick decline in the intention to build, which signifies house price weakness in the near term as developers expect sales will be harder to achieve.
Chart 4: Building permits, new houses and house prices
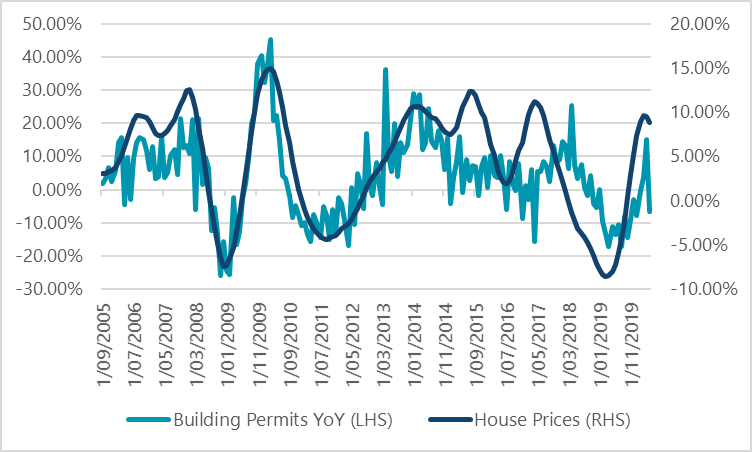
Source: Bloomberg, Nikko AM
In the short term, all three indicators are pointing to the same outcome: house price declines of approximately 5% to 10%. When answering our original question - “How concerned should we be?” - these indicators tell us that we should be at least mildly concerned.
Yet this outlook only reflects what is already known and observable, providing only a 3- to 6-month outlook without making much reference to what could be in store in 12 months’ time.
So we must also think about how these indicators could move in the bigger picture environment, and whether they generate greater concern. The longer-term analysis is included in the next article.
Chris Rands is Portfolio Manager, Fixed Income at Nikko AM Limited. The information contained in this material is of a general nature only and does not constitute personal advice, nor does it constitute an offer of any financial product. Figures, charts, opinions and other data, including statistics, in this material are current at the date of writing, unless stated otherwise. This is not a recommendation in relation to any named securities or sectors and no warranty or guarantee is provided.
The full paper can be viewed here.