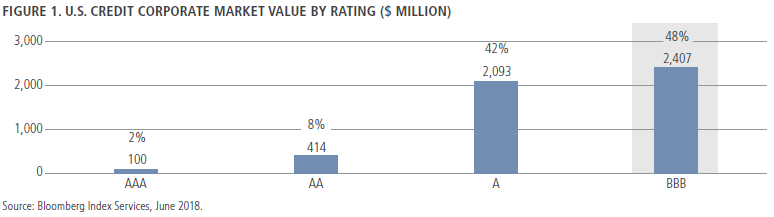
Investors have become increasingly concerned about growing credit risk in the investment grade corporate market. An area of particular concern is the BBB rating category, which accounts for roughly half of the investment grade index and is a third larger than the high-yield market. The fear is that, when the U.S. reaches the end of its economic cycle, much of the BBB segment will be vulnerable to downgrades that disrupt the credit markets by flooding the high-yield market with ‘fallen angels’.
The BBB credit picture
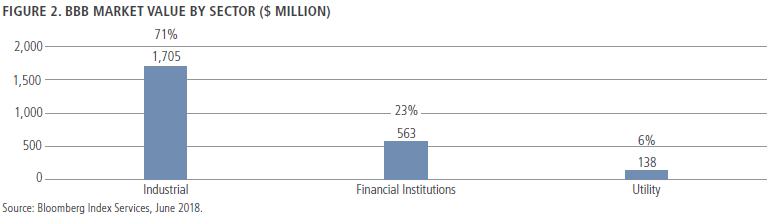
BBB-rated companies make up nearly half of the US Investment Grade Credit Corporate Index. Within the BBB component of the index, more than two-thirds of market capitalisation is in Industrial bonds, while roughly a quarter is in Financials and the remainder is in Utilities.
In the wake of the 2008 GFC, credit rating standards for financial institutions became far more stringent, while many institutions improved their capital position. This created an anomalous situation in that credit ratings for financial issuers moved lower even as credit quality improved. We do not believe that the growth of Financial BBB bonds presents a particular issue for investors. In fact, we currently have a favourable view of fundamentals in the Financials sector, where companies have reduced leverage and responded to stricter regulations, while taking a more even-handed view of bondholder and shareholder interests. Taking valuation into account, we believe that the sector appears relatively attractive at this point, even late in an economic cycle.
BBB growth matches the market, but is weighted to lower quality
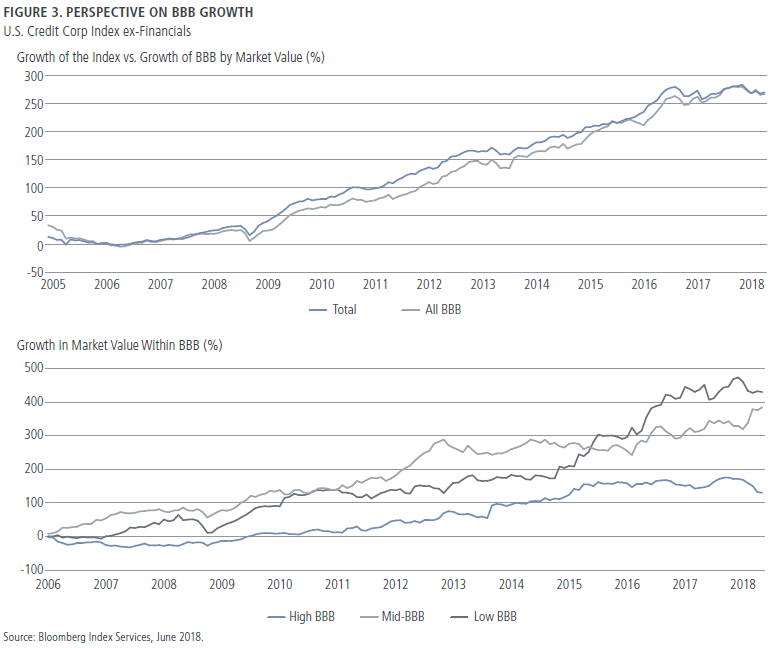
If we take Financials out of the picture, it becomes evident that, contrary to the perception of ‘out of control’ BBB growth, the segment’s expansion since 2005 roughly matches that of the broader credit market, as represented by the U.S. Credit Corporate ex-Financials Index. A more concerning trend, however, is the weighting of growth within the BBB space, where lower-quality accounts for the bulk of recent market-value growth.
Since 2005, BBB Industrials have grown at a rate similar to the market, at about 270% on a cumulative basis. But within BBBs, low-BBB growth has been the highest, at more than 400%.
In recent years, debt financing related to energy infrastructure projects in the midstream sector has accounted for about 40% of the increase. Following the oil price decline, midstream companies have largely worked to defend and stabilise their investment-grade ratings to diminish the threat of rating downgrades in the event of a cycle turn.
The remaining portion of low-BBB growth is attributable to leveraging M&A activity in historically free-cash-flow-generative sectors such as Health Care/Pharma, Food and Beverage, and Cable/Media as companies pursued growth opportunities amid changing industry dynamics.
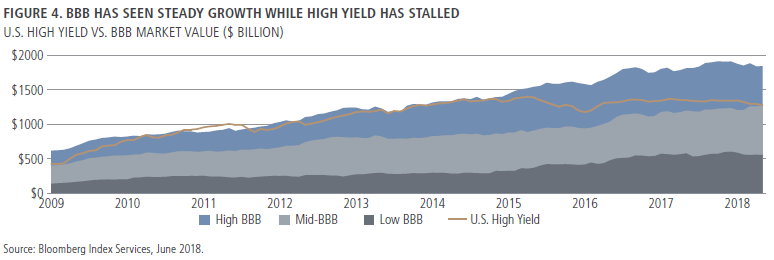
Aside from the overall volume of BBB, a source of worry has been growth compared to the high-yield universe. Indeed, after moving from rough equality five years ago, the entire BBB Industrials market is now worth $1.8 trillion compared to the high-yield total of $1.3 trillion. This change is not the result of acceleration in BBB-rated debt growth, but rather stalling of high yield growth, as shown in the chart below. On average over the past 20 years, about 3.5% of BBB Industrials by market value has migrated from investment grade to high yield each year.
Gauging risk at the sector level
Despite these mitigating facts, it is undeniable that the amount of BBB corporate credit in the market has grown, and that leverage within the group has increased as well. A key task for investors is to identify where the risk lies. An assessment by sector helps draw those lines.
In the chart below, the seven sectors on the left (out of a total of 25 sectors excluding Financials) represent two-thirds of the category’s market value and have been largely responsible for the recent growth in the BBB category.
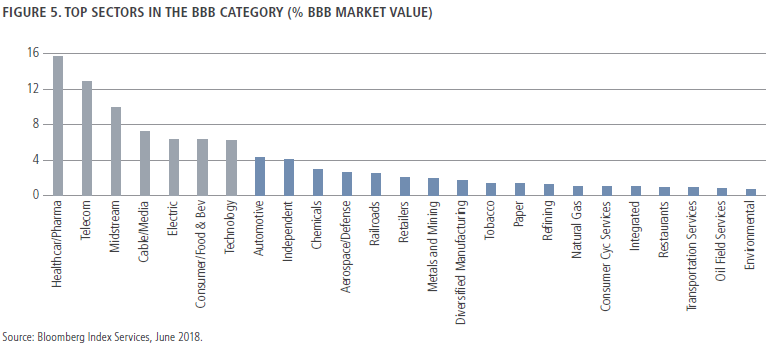
Naturally, the mere fact that a sector is a major weighting in the index does not point to additional risk. In the case of the BBB sector, we’ve seen an increase in general risk levels due to leverage-driven mergers and acquisitions in historically defensive sectors. For example, in Telecom and Cable/Media, changing consumer behaviour and technological disruption have resulted in debt-financed consolidation. In Health Care/Pharma, growth challenges in the face of pricing headwinds, patent expirations and maturing portfolios, have led to increased M&A as companies search for growth. In Consumer/Food and Beverage, evolving consumer preferences and challenges for retailers have led to leveraged M&A to help ‘buy’ growth.
In our research, we have sought to gauge the vulnerability of these categories to rating downgrades in the event of a cyclical downturn. The key differentiators relate to leverage levels, industry dynamics and the flexibility (or lack thereof) that sectors may have in dealing with economic adversity.
As noted, the growth of the BBB sector has been driven in part by sectors that have historically been regarded as more defensive with predictable earnings profiles. In some of these sectors, we are less worried because we expect free-cash-flow generation to be supportive of near-term debt reduction goals and note the availability of levers that can be pulled to preserve credit quality.
Conclusion on BBB quality
The purpose of our research was not to discredit the idea that the use of leverage has increased, and indeed we believe that debt has reached unhealthy levels for some companies. However, it would be a mistake to indiscriminately sell BBB risk. Financial BBBs simply do not meet the definition of troubled credits, and in our view are attractive from a fundamental perspective. Moreover, within the Industrials segments, there is considerable variety with regard to business model and issuer flexibility. Some companies may be vulnerable to downgrades late in the cycle, even in traditionally defensive sectors. Specifically, the Health Care/Pharma, Cable/Media and Consumer/Food and Beverage sectors have traditionally been valued for their stable free-cash flows late in the cycle, but some issuers in these sectors now carry more aggressive debt levels. In contrast, other sectors, such as Utilities, should be able to perform ‘as advertised’.
As always, the ability to make such distinctions is a function of fundamental credit research at the sector, industry and issuer levels.
Neuberger Berman is the manager for the listed NB Global Corporate Income Trust (ASX:NBI).
Adam Grotzinger is a Senior Portfolio Manager at Neuberger Berman, a sponsor of Cuffelinks. This material is provided for informational purposes only and nothing herein constitutes investment, legal, accounting or tax advice, or a recommendation to buy, sell or hold a security. It does not consider the circumstances of any investor.
For more articles and papers by Neuberger Berman, please click here.