The CEOs of the big four banks were grilled by the House of Representatives’ Standing Committee on Economics last week. The committee wanted to know why Australian banks have higher returns on equity (13.8% ROE) and profits than those in other Western countries and whether it is due to their market power.
This appears to be both an exercise in political point-scoring and data mining. I strongly doubt it would be in the national interest if Australian banks generated the returns of the European banks (4% ROE excluding Deutsche Bank). Weak returns limit internal capital generation and increase financial precariousness and thus the risk of taxpayer-funded bailouts. Indeed, in a more comparable and similarly structured banking market such as Canada (ROE 14.8%) has five dominant trading banks (CIBC, Royal Bank of Canada, Toronto Dominion, Bank of Montreal & the Bank of Nova Scotia) in a highly regulated market. Shareholders could make the case that the Australian bank CEOs are not trying hard enough to generate profit!
This article examines the different measures of corporate profitability for listed companies, looking beyond the billion dollar headline figures.
Measures of profitability
As a fund manager, the $29 billion of raw profit made by Australian banks over the past year does not mean much by itself. I look at the underlying earnings per share (EPS) that my unitholders receive from that profit. We also look at growth in EPS, as a company’s profits can often grow substantially when they make an acquisition, but if that acquisition is funded by issuing a large number of additional shares, profit per share might not actually grow. For example, telecommunications company TPG reported a sensational 60% increase in underlying profit this year after the acquisition of iiNet. However, earnings per share grew at a much lower rate after TPG issued additional shares to fund the purchase.
Additionally, at a company level, we look at measures such as return on assets, equity and profit margins, which can be better measures of how efficient a company’s management is utilising the capital or assets belonging to shareholders in generating the annual profits.
Return on equity
Return on equity (ROE) looks at the profit generated by the equity that the owners have contributed to establish the business. ROE is calculated by dividing a company’s profit by the money shareholders have invested in it. This investment by shareholders includes both the original capital given by shareholders in the Initial Public Offering (IPO) plus retained earnings. Retained earnings are the profits kept by the company in excess of dividends and are used to fund capital expenditure to either maintain or grow the company. Companies with high ROE typically require little in the way of dilutive equity raisings from shareholders to run their business, or may be financed primarily from debt rather than shareholder equity.
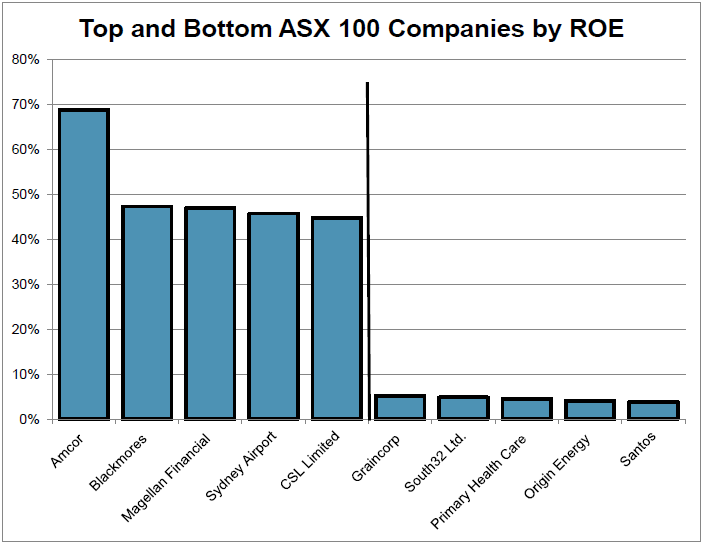
The above chart shows the top and bottom five companies in the S&P/ASX100 as ranked by ROE. The top ROE earners contain a packaging company (Amcor), a vitamin company (Blackmores), a fund manager (Magellan), a highly geared utility (Sydney Airport) and a healthcare company (CSL).
The common factor in these businesses is minimal ongoing capital expenditure to run the company. Bringing up the rear are a range of capital-heavy businesses that required a large amount of initial capital to start the business and large capital injections from shareholders to maintain their assets and finance ongoing activities. This sub-set includes energy companies (Santos and Origin), a miner (S32) and a grain handler (Graincorp).
Return on assets
Return on assets (ROA) differs from ROE, as it measures the return a company makes on its total assets. This measure accounts for both the equity and the debt used to purchase the assets that generate profits.
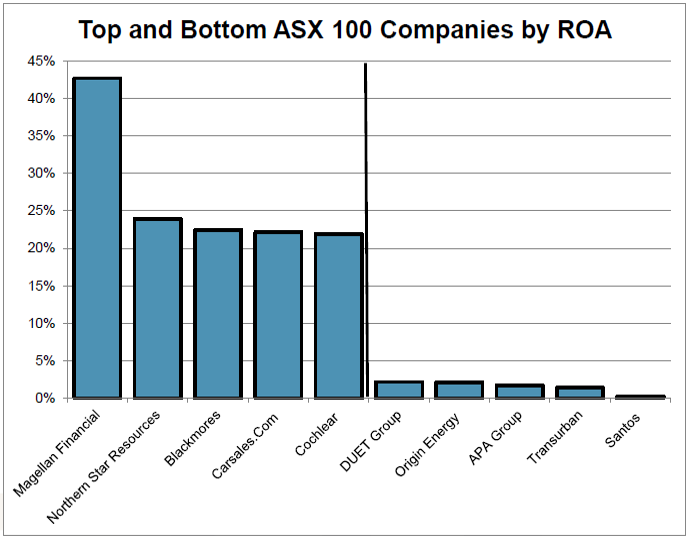
The chart on the right shows the top and bottom companies in the S&P/ASX100 ranked by ROA. Companies generating a high ROA generally have minimal to no debt such as Magellan, Carsales.com or very low debt such as CSL and Cochlear. Here the factor driving profits in internet and healthcare companies is generally a smart idea (online real estate listing replacing paper) or a piece of medical research, rather than expensive tangible assets such as steel mills or airplanes bought with capital raised from both shareholders and lenders.
Similarly fund managers (Magellan) enjoy significant operating leverage, as once the fixed cost of fund distribution, office rent and fund manager salaries are covered, each additional dollar of revenue is almost pure profit that requires minimal capital. Gold miner Northern Star sneaks onto this list due to the combination of high global gold prices and a low capital intensive business model.
Alternatively, companies that have a low return on assets typically require expensive hard assets to generate profit. These assets range from utilities (Transurban, DUET and APA) and energy companies (Santos and Origin). Typically hard asset companies such as Qantas, BlueScope and Boral appear on the list of the bottom ROA companies, but these are all currently enjoying their cyclical time in the sun due to company-specific factors.
Profit margin
Profit margin is calculated by dividing operating profits by revenues and measures the percentage of each dollar a company makes that results in profit to shareholders. Typically, low-margin businesses operate in highly competitive mature industries. The absolute profit margin is not what analysts will look at, but rather the change from year to year, as a declining profit margin may indicate stress and could point to future declines in profits.
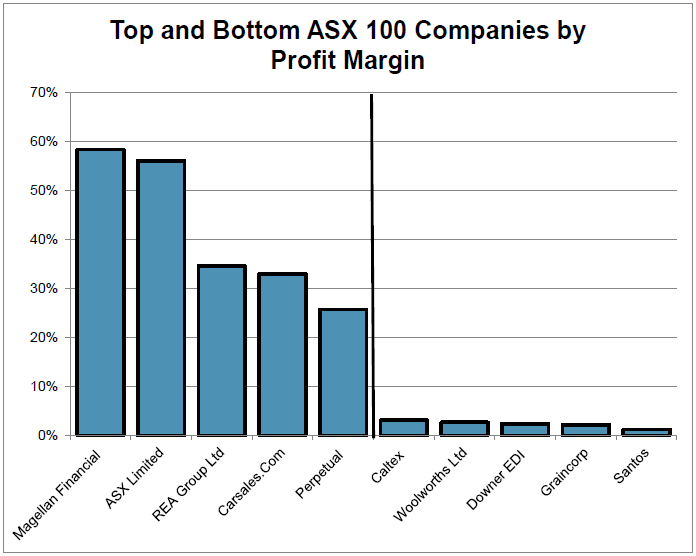
The chart on the right shows how companies generating the highest profit margins are monopolies (ASX), fund managers enjoying the operating leverage (Magellan and Perpetual) or internet companies (REA and Carsales.com).
Low profit-margin companies characteristically receive large revenues, but operate in intensely competitive industries such as petrol retailing (Caltex), engineering (Downer) and staples retailing (Woolworths). Graincorp makes this list due to lower grain exports and a relatively poor east coast wheat harvest. Companies with low profit margins are forced to concentrate closely on preventing them from slipping further, as a small change in those margins is likely to have a significant impact on the profit that can be distributed to shareholders.
While the banks deliver large absolute profits and make big headlines, they are not among the most profitable S&P/ASX100 companies in terms of profit margins and returns on assets. The Commonwealth Banks’s 45,129 employees produced a $7.8 billion profit in 2016, but this represented a ROE of 16.5% and a profit or net interest margin of only 2.07% on assets of $933 billion.
Hugh Dive is Senior Portfolio Manager at Aurora Funds Management.