Register For Our Mailing List

Register to receive our free weekly newsletter including editorials.

Home / 632

Expensive market valuations may make sense

The global stock market looks stretched at first glance—but the story is more nuanced once you dig beneath the surface. The perception of lofty valuations is being driven almost entirely by the very largest companies, while much of the rest of the market is priced closer to historical norms.

Why the market looks expensive

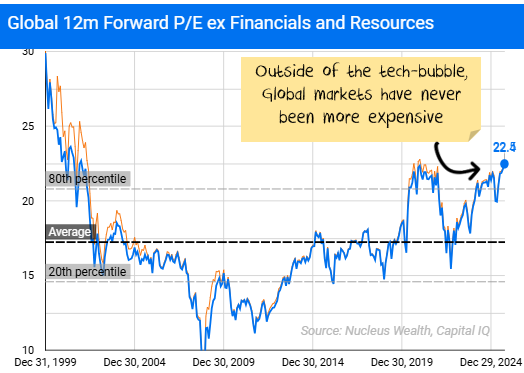
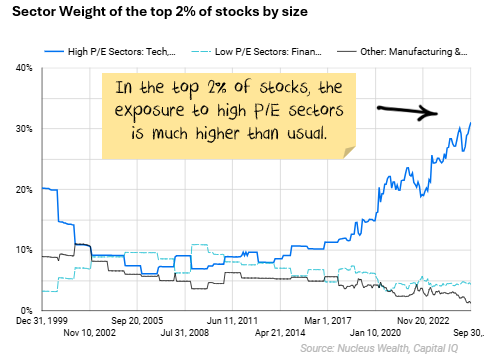
Headline market valuations, particularly when measured by forward price-to-earnings (P/E) ratios, suggest that stocks are expensive. However, when we separate companies into groups based on their size, it becomes clear that the top names—typically high-growth, mega-cap technology and consumer firms—are disproportionately pulling averages higher.

These giants command premium multiples that skew weighted averages upward, making the entire market look pricier than it really is.

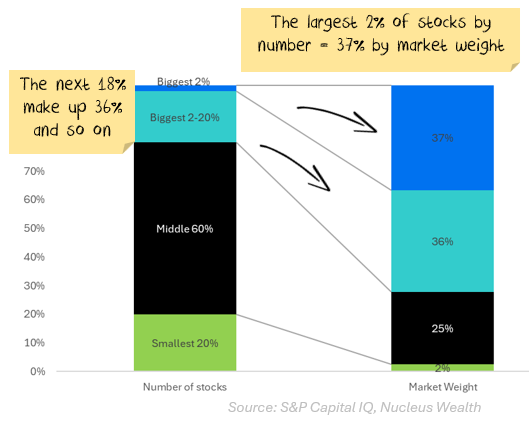
First, a quick definition. I'm looking at the top 1,500 developed market stocks globally - about 80% of the market capitalisation of all stock markets. Then, I've created 4 buckets of stocks:

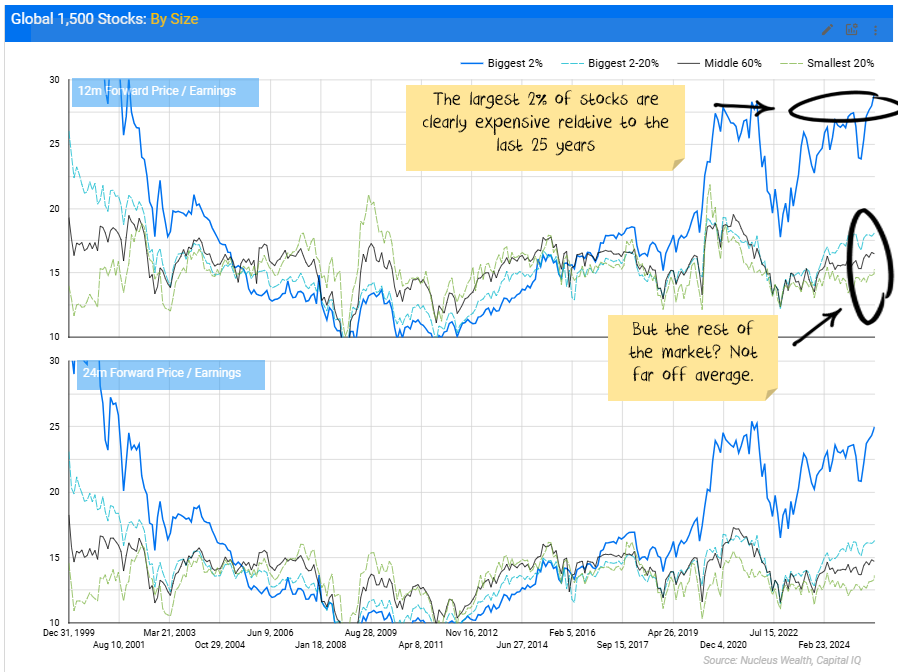
When you look at it this way, the problem seems like it is limited to just a handful of stocks:

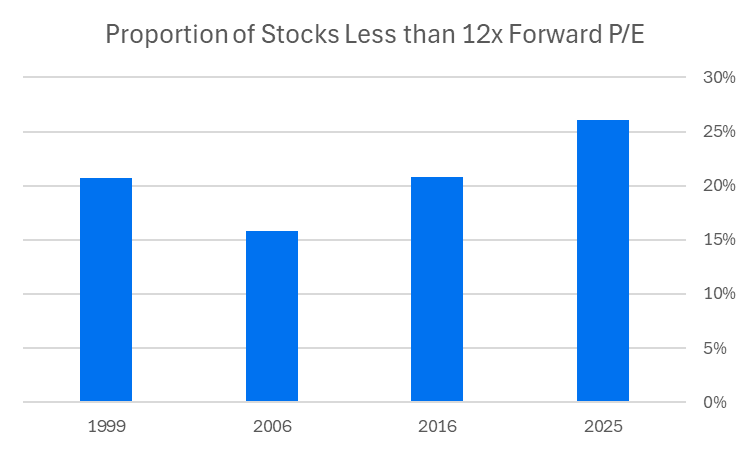
And if you want to get fancy with stats, you can see that there are more stocks with a low ratio (12x forward price/earnings) today than there were in a more moderately priced 2016, or before bubbles burst in 1999 or 2006:

Could there be an alternative narrative?

Even in a rational world, the stocks that are expected to grow faster should have a higher price/earnings ratio.

What would a world look like if it just happened that the largest stocks also came from higher price/earnings sectors, and had the best growth outlook?

The answer: a lot like it does today...

Which doesn't say the valuations are right, but it does colour the lens through which we should be looking at them.

Sector composition matters

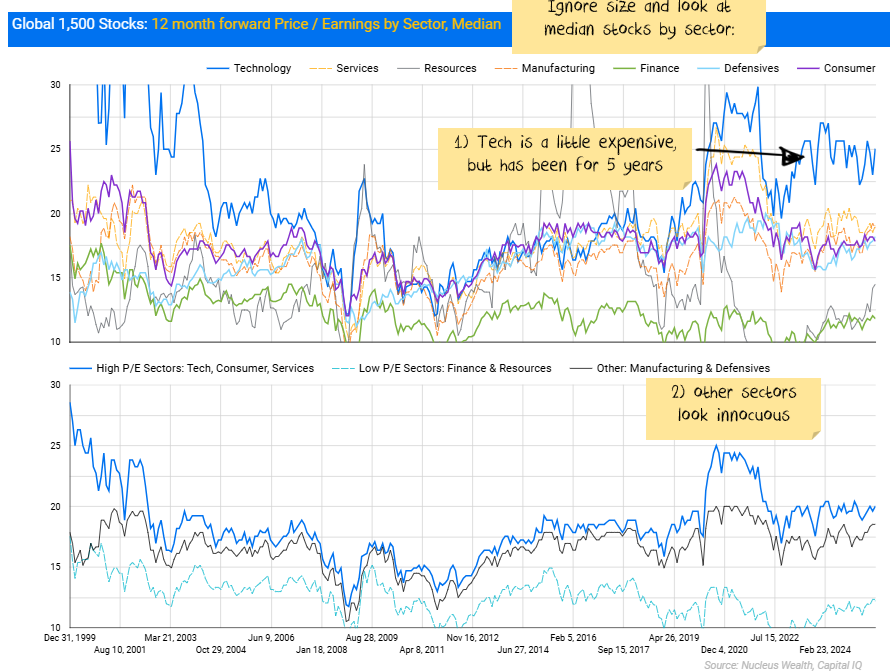
Some of the difference is just the sectors. There are some sectors which are traditionally low price/earnings because the earnings are riskier, or the leverage is much higher. Banks and resources usually fall into that camp.

Some sectors are traditionally higher price/earnings. Usually because of more stable earnings, lower capital expenditure or lower leverage. Consumer, services or technology stocks often fall into this category.

To put it another way, if the top 2% of stocks (by size) had lots of financials, then you would expect a lower P/E than if they were all services or tech stocks. Which largely correlates with valuation moves.

If you ignore size and just look at medians, most sectors do not look expensive:

Growth expectations: Reality vs. hype

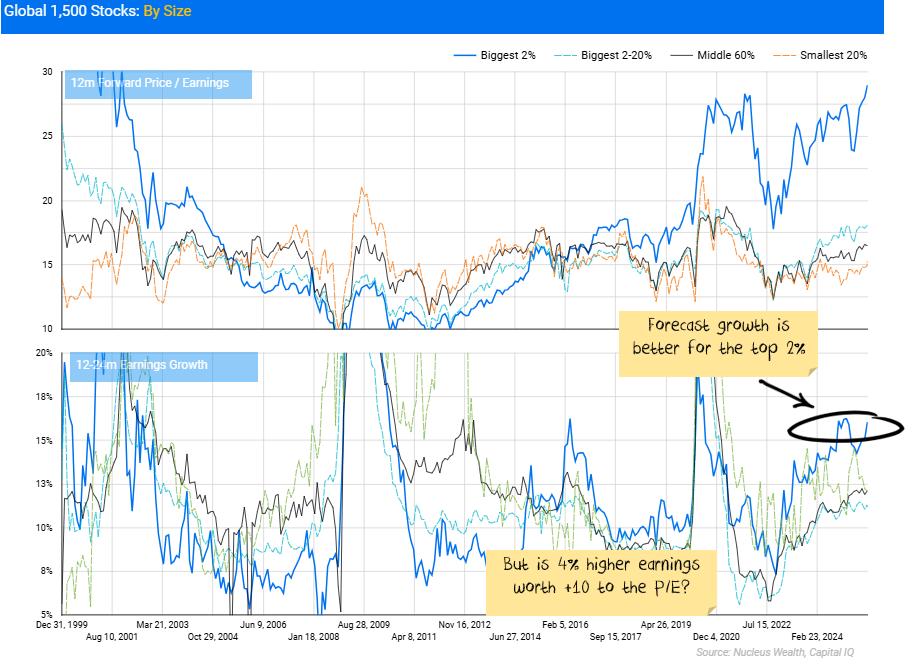
So, is the difference just that the largest stocks also happen to be the highest growth?

Certainly, on forecasts, that is the case. But not by that much:

A rational case for today's valuations

Say the US goes into a reasonably sized economic slowdown:

  • Stocks exposed to the consumer get hit, and most ‘moderately priced’ sectors that are not tech see earnings downgrades. Stock prices also fall.
  • The Fed cuts interest rates
  • The tech sector keeps spending on AI and data centers, funded by lower interest rates and fear of falling behind competitors. The slow down in other sectors reduces the competition for construction resources.
  • Capital markets stay open, we see a rash of AI IPOs, most of which gets plowed back into buying stuff from other tech companies
  • Under Trump there is little anti-trust activity in the AI sector, most of the benefits accrue to the largest companies
  • Large tech sector earnings increase

Let us talk valuation. What would the growth differential need to be to justify paying 28x today for a large tech stock vs 16x for other companies?

Say we are talking net present value in broad terms. A discount rate of 11%, ten years of tech stocks growing faster than other stocks, then long term earnings growth of 5% for all stocks.

The answer? About 9%. i.e. if tech stocks can grow at say 12% p.a. while the rest of the market does 3% for 10 years then it would be rational to pay 28x for large tech stocks vs 16x for other stocks.

Maybe you value the low debt levels, high and stable margins that the tech sector brings. Then, you could easily argue that a 5-6% difference in growth would be enough.

Net effect

Stock markets are not cheap at an aggregate level. But, within the sectors and growth profiles there might be more rationality in the pricing than might first appear.

It might look safer in the lower-priced sectors, but there is a lot more earnings risk in those stocks from tariffs and general Trump driven-disruption.

Tech stocks are not cheap. But for most of the largest ones, the earnings are high quality, not volatile and margins are wide.

I'm not entirely convinced. But I'm enough convinced to be mostly invested at the moment. And I am convinced that the right lens is to consider how much AI stock earnings will exceed non-AI stocks, and then work out how much more should you pay for that growth.


Damien Klassen is the Chief Investment Officer at Nucleus Wealth. This article is general information and does not consider the circumstances of any investor.


  •   8 October 2025
  • 3
  •      
  •   
3 Comments
Ramon Vasquez
October 10, 2025

Hi Steve ... the stats say " Yes " . Cheers , Ramon .

Klassen
October 10, 2025

Two answers:
1. If you think that the AI capex boom is a bubble that will pop soonish then yes
2. If you think the AI capex boom has further to run then you need to work out whether you would prefer to pay 15-16x for a stock not in the boom or 26x for a stock exposed to the boom.


Leave a Comment:

RELATED ARTICLES

Why are some companies vulnerable in 2022?

The case for and against US stock market exceptionalism

Searching for value in tech stocks

banner

Most viewed in recent weeks

Indexation implications – key changes to 2026/27 super thresholds

Stay on top of the latest changes to superannuation rates and thresholds for 2026, including increases to transfer balance cap, concessional contributions cap, and non-concessional contributions cap.

The refinery problem: A different kind of energy crisis in 2026

The Strait of Hormuz closure due to US-Iran conflict severely disrupted global energy supply chains. While various emergency measures mitigated the crude impact, the refined product market faces unprecedented stress.

The missing 30%: how LIC returns are understated, and why it matters

The perceived underperformance of LICs compared to ETFs is due to existing comparison data excluding crucial information, highlighting the need for proper assessment and transparent reporting.

Little‑known government scheme can help retirees tap into $3 trillion of housing wealth

The Home Equity Access Scheme in Australia allows older homeowners to tap into their home equity for retirement income, yet remains underused due to lack of awareness and its perceived complexity.

Origins of the mislabeled capital gains tax ‘discount’

Debate over the CGT discount is intensifying amid concerns about intergenerational equity and housing affordability. This analysis shows that the 'discount' does not necessarily favor property investors.

Div 296 may mean your estate pays tax on assets your beneficiaries never receive

The new super tax, applying from 1 July, introduces more than just a higher rate on large balances. It brings into focus a misalignment between where wealth sits and where the tax on that wealth ultimately falls.

Latest Updates

The ultimate superannuation EOFY checklist 2026

Here is a checklist of 28 important issues you should address before June 30 to ensure your SMSF or other super fund is in order and that you are making the most of the strategies available.

Retirement

Two months into retirement

A retirement researcher's take on retirement and her focus on each of her six resource buckets to stay engaged during the transition and beyond.

Superannuation

Markets have always delivered for super fund members. What if they don’t?

What happens if market resilience in the face of ongoing geopolitical tensions ends? Potential decade-long market weakness shows the need for contingency planning.

Retirement

We tend to spend less in retirement …

Studies show that a drop in expenditure during retirement leads to a happier retirement. But when costs ramp up again later in life, it's a guaranteed income that makes spending more hurt less.

Shares

Can you value a share just using dividends?

A cow for her milk, a stock for her dividends. Investors are too quick to dismiss this valuation technique. 

Property

The 25-year property trust default is being questioned

The 33% CGT discount rate being floated isn’t random. It sits at the structural break-even between trust and company for the multi-property cohort. That’s driving the conversation we’re hearing now.

Investment strategies

Are active managers bringing a knife to a gunfight?

How passive investing has permanently changed market structure — and why sophisticated tools are now the price of survival.

Sponsors

Alliances

© 2026 Morningstar, Inc. All rights reserved.

Disclaimer
The data, research and opinions provided here are for information purposes; are not an offer to buy or sell a security; and are not warranted to be correct, complete or accurate. Morningstar, its affiliates, and third-party content providers are not responsible for any investment decisions, damages or losses resulting from, or related to, the data and analyses or their use. To the extent any content is general advice, it has been prepared for clients of Morningstar Australasia Pty Ltd (ABN: 95 090 665 544, AFSL: 240892), without reference to your financial objectives, situation or needs. For more information refer to our Financial Services Guide. You should consider the advice in light of these matters and if applicable, the relevant Product Disclosure Statement before making any decision to invest. Past performance does not necessarily indicate a financial product’s future performance. To obtain advice tailored to your situation, contact a professional financial adviser. Articles are current as at date of publication.
This website contains information and opinions provided by third parties. Inclusion of this information does not necessarily represent Morningstar’s positions, strategies or opinions and should not be considered an endorsement by Morningstar.