Differences of opinion make a market, but there is a stark contrast of views among leading equity fund managers at the moment. While the bulls point to better global growth and shares looking far better than bonds on a relative value basis, the bears argue the market's low volatility is an unwarranted complacency at a time of high valuations. In Sydney this week, global equity manager Hexavest was clearly among the bears, concluding:
"Calm and stability lead to imprudent behaviour. When volatility drops, many investors let their guard down and increase their exposure to risky assets, often confusing risk with volatility ... the return of volatility has the potential to do a lot of damage."
Among the charts Hexavest used to support its argument, the following were highlights.
1. Everything is expensive
Hexavest quotes Deutsche Bank research which shows the expensiveness of financial assets as a risk factor. In the graph below, Deutsche aggregates 15 developed market bond and equity valuations, and with equities in the 90th percentile of historical distributions since 1800, and bonds the most expensive ever (that is, yields the lowest), the risks are obviously asymmetrical.
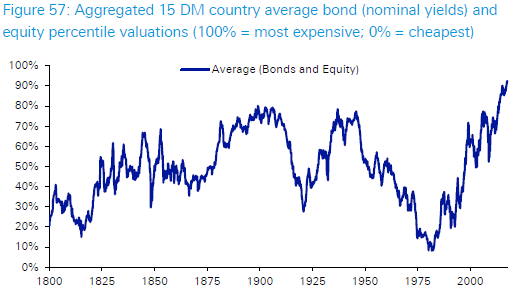
Source: Deutsche Bank, Global Financial Data, Bloomberg Finance LP
2. Low volatility and high P/E ratios
Hexavest believes many current valuation and sentiment indicators are consistent with a bubble, a term most market experts do not use lightly. Many investors believe the US market is overvalued but continue to buy due to the lack of alternatives, some calling this “the most hated bull market in history”. The low volatility in equity prices lulls investors into a sense of security, and they allocate more of their risk budget to shares. The fear is that when volatility rises, these same buyers will rapidly become sellers.
The following chart divides forward P/E ratios (a measure of the market valuation) by the VIX index (a measure of market expectations of near-term volatility). This measure demonstrates the mix of high values and risk complacency. Any ratio which is at an all-time high and over three standard deviations away from its mean since 1990 is a warning that the markets face a correction at some time. The problem facing all investors is knowing when to leave the dance party. The year before the market crash of 1987, the Dow Jones added 37%.
Hexavest says:
“It is generally recognised that valuation is not a good leading indicator of short-term equity market returns. In our view, it is a different story when valuations reach extreme levels. In the past, when valuations were stretched to this degree, we generally saw negative returns in the ensuing 12 months.”
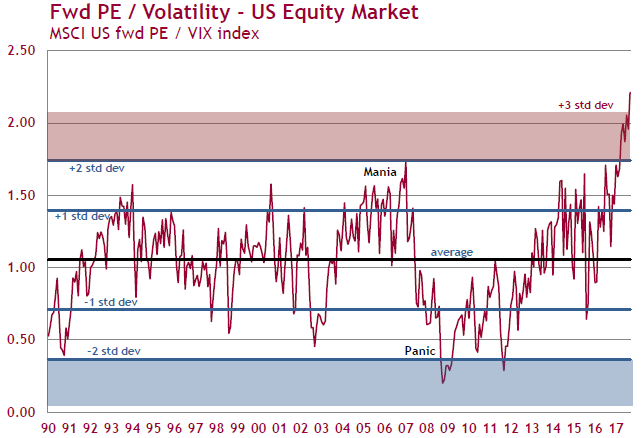
Sources: Hexavest, Datastream
3. Share markets trading without material corrections
Equity markets are calm despite elevated levels. Not only is the VIX at historical lows, but in the last 12 months, the number of trading days with a 1% or more loss is also at historical lows. The S&P 500 index has not had a drawdown more than 3% since November 2016, a run of over 240 days which is the longest since 1928. Historically, such calm periods usually end without warning.
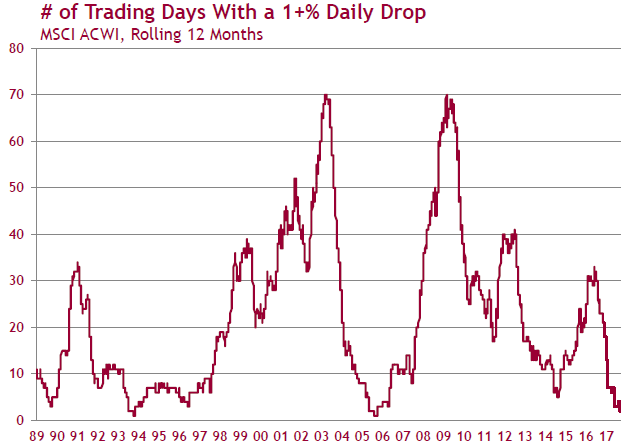
Sources: Hexavest, Datastream
4. Asset allocators making record equity investments
Professional fund managers who run multi-asset portfolios can allocate across bonds, equities, property or whatever, depending on their perception of risk and return. Those who manage so-called 'risk-parity' portfolios focus on the allocation of risk, measured by volatility, rather than the dollar size of positions. With bonds offering low returns and equity risk perceived as low, funds have placed a record amount into equities. These allocators have the ability to buy and sell quickly when they are exposed to risk increases, especially when their risk budgets are fixed and they are forced sellers.
US households also have high equity allocations, and while their holdings of equities is not at the pre-‘tech wreck’ levels of 2000 (about 42%), they are currently over 35% which is above the pre-GFC level of 34% and the long-term average of below 25%.
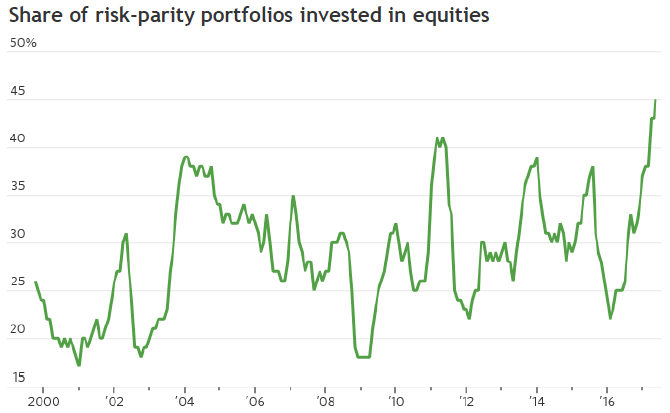
Source: Morgan Stanley Research
5. Optimism among all types of investors
Across many types of investor populations (including individuals, institutions, hedge funds, mutual funds, etc), the attraction of a rising stock market is too strong to resist, and cash holdings are at record low levels. Institutions usually have an average cash holding of 5% and it is currently about 2%.
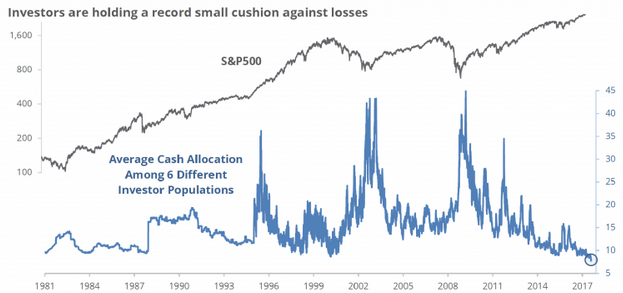
Source: ICI, BofA, Rydex, Federal Reserve, SENTIMENTRADER
Conclusions
Hexavest acknowledges economic growth has maintained a decent pace, but contrary to the gathering market optimism, they believe risks tilt to the downside. Investors should watch for markets anticipating an economic slowdown, or a decline in risk appetite, as a sign of a potential end to the equity market rally. Timing is difficult: "If history is any guide, investors will anticipate or perceive an economic slowdown and reduce their exposure to equity markets before it is confirmed by economic data."
Graham Hand is Managing Editor of Cuffelinks. Hexavest was founded in 2004 and is a Montreal-based equity manager that targets institutional clients rather than retail. This material is not investment advice and it does not consider the circumstances of any investor. It is based on material considered to be reliable but no assurances are given.
Bull or Bear? What is your opinion on the medium term outlook for equity markets? After reading this article as well as Graham’s other piece Three reasons the bull keeps running, we invite you to voice your opinion in this short survey: