Due to the tendency of stock prices to over and undershoot fundamentals over the economic cycle, both finance theory and empirical evidence suggests that ‘fundamentally weighted’ equity indices (FWIs) should, over time, outperform more traditional market-cap weighted equity indices (MCWIs). It’s also the case that FWIs endure periods of underperformance, usually arising when ‘momentum’ rather than valuation-based ‘regression to the mean’ is driving market performance.
Contrast cap-weight index and fundamental-weight index
As should be clear, MCWIs weight stocks according to their price-based market capitalisation. If the combined capitalisation of stocks in the S&P/ASX 200’s Index was $1.5 trillion, and company X had a market capitalisation of $150 billion, its weight in the index would be 10%.
By contrast, a FWI weights stocks according to non-price related measures of economic importance. In the case of the FTSE RAFI Australia 200 Index, for example, weights are based on four equally weighted factors: a company’s cash flow, dividends, sales and book value, with the first three of these measures averaged over the previous five years, and the last based upon the most recent accounting value.
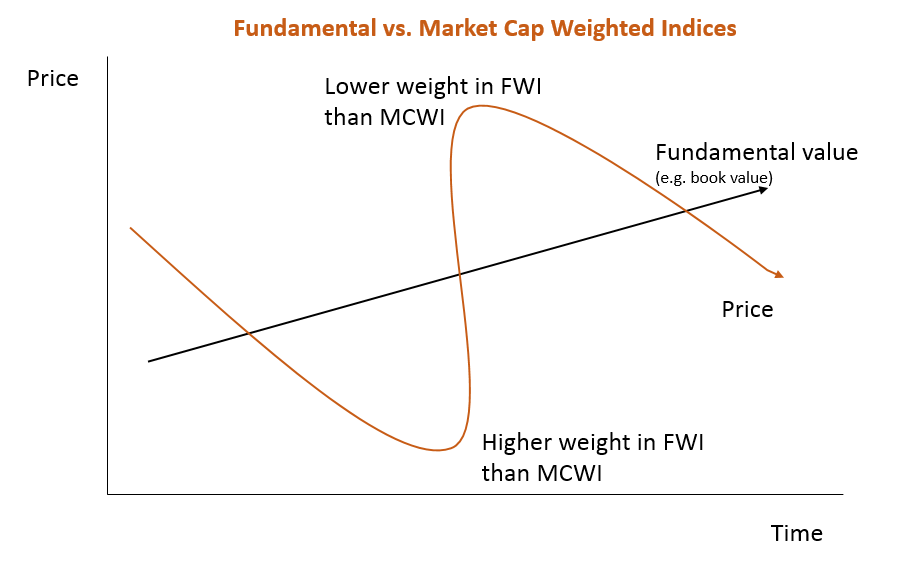
As seen in the chart below, the upshot of this approach is that FWI’s will tend to be underweight stocks (compared to a MCWI) when their prices are relatively high compared to sales, earnings, book value and dividends, and over-weight these stocks when their prices are relatively low compared to these other non-price measures of a company’s importance.
Regression to the mean
In what’s known as ‘regression to the mean’ in value, to the extent relatively high price stocks eventually tend to underperform, and relatively low priced stocks eventually tend to outperform, finance theory suggests the FTSE RAFI Australian 200 Index should tend to outperform the S&P/ASX 200 over time.
Of course, this theory does not suggest FWIs will necessarily always outperform MCWIs. At least conceptually, the periods of over and under-performance of a FWI are outlined in the diagram below.
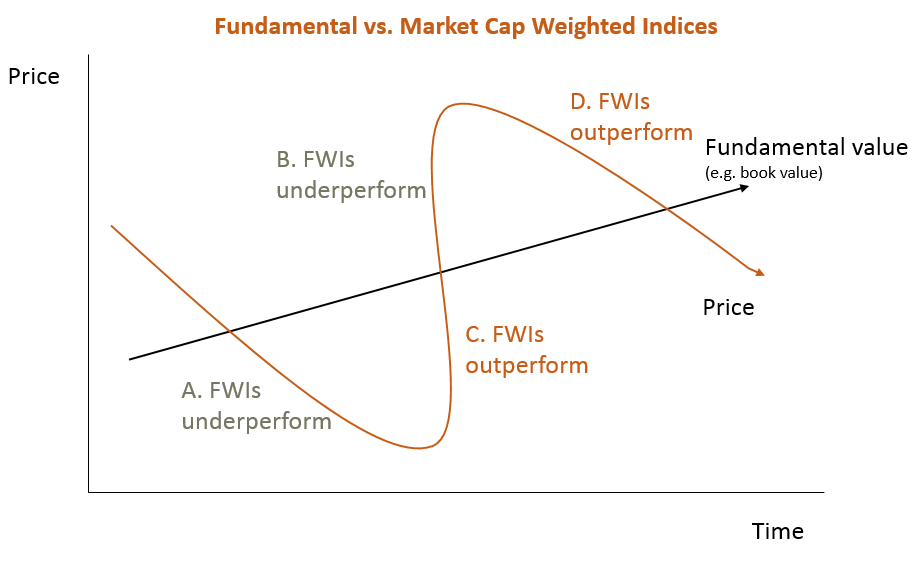
This diagram suggests that when stocks with a high price to fundamental value are continuing to outperform (as during the late stages of a speculative bull market at point B) or when stocks with a low price to fundamental value are continuing to underperform (as during the late stages of a bear market when despair is at its most extreme as at point A), FWIs will tend to underperform MCWIs.
FWIs then tend to outperform when beaten down cheap stocks rally relatively strongly in the early stage of a bull market (point C in the chart), and again when expensive stocks fall hardest in the early stage of a bear market (point D in the chart).
Simulated and actual performance
So much for the theory. Whether FWIs outperform MSWIs over time is ultimately an empirical question. Note that the FTSE RAFI Australia 200 Index was launched in August 2009. Index returns prior to launch are simulated based on Research Affiliates’ non-capitalisation weighted indexing system. Actual investment results may differ from simulated results.
As seen in the chart below, the FTSE RAFI Australia 200 Index (simulated plus actual) has tended to outperform the S&P/ASX 200 index over time, though relative performance has nonetheless varied over shorter time periods. Through most of the early 1990s, the RAFI Index outperformed, culminating in a strong surge of outperformance 1998-1999.
Relative Performance: S&P/ASX 200 Index v FTSE RAFI Australia 200 Index: May 1992-December 2015
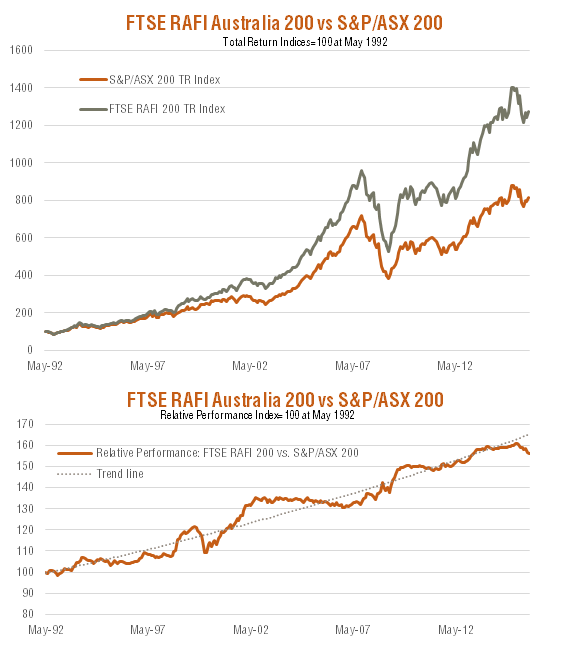
Source: Research Affiliates and BetaShares. Graph shows performance of FTSE RAFI Australia 200 index relative to S&P/ASX 200 index, not ETF performance and does not allow for ETF management costs. You cannot invest directly in an index. Past performance is not an indicator of future performance of index or ETF.
The most abrupt period of underperformance was during the height of the dotcom bubble between mid-1998 and early 2000. But the Index then again outperformed as tech stocks crashed.
Recent RAFI underperformance
More recently, the RAFI Index has underperformed again, with a return of only 0.4% in 2015 compared to 2.6% for the S&P/ASX 200 Index. RAFI underperformed largely due to two factors: an overweight sector exposure to the underperforming resources sector, and an underweighting to the strongly performing health care sector.
In view of these cycles in relative performance, perhaps the most important statistic is that since the early 1990s, the since-inception outperformance of the RAFI Index over the S&P/ASX 200 Index has been 2.1% p.a.
Notwithstanding the recent underperformance, both finance theory and empirical evidence supports the view that the fundamental indexation strategy has the potential to add value to an investor’s portfolio.
David Bassanese is Chief Economist at BetaShares, a leading provider of ETFs. This article is for general information purposes only and neither Cuffelinks nor BetaShares are tax advisers. Readers should obtain professional, independent tax advice before making any investment decision.
BetaShares currently has two ETFs which track indices based on the RAFI fundamental indexation methodology – the BetaShares FTSE RAFI Australia 200 ETF (ASX: QOZ) and the BetaShares FTSE RAFI U.S. 1000 ETF (ASX: QUS).