Register For Our Mailing List

Register to receive our free weekly newsletter including editorials.

Home / 18

How much income tax do you pay?

There’s a never-ending debate about income inequality and how much taxes people at varying income levels should pay. This was brought onto the front pages by the Occupy movement, which highlighted in the United States that the top 10% of households had an income 11 times larger than the bottom 10% (sometimes called the 90/10 ratio). In Australia, income inequality is not this extreme, with the top 10% about 4 times larger than the bottom 10%.

This article does not buy into the social or equity arguments about income and tax distribution, but as we approach the end of another financial year where tax has again been high on the agenda, it’s interesting to see where personal income tax receipts come from.

A reminder of the current tax scales (check ATO website for updates):

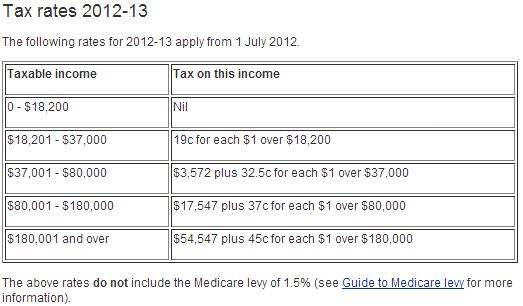
The latest available statistics on numbers and amount in each tax bracket are from 2010/2011, when the bottom tax scale cut out at $6,000. In coming years, there will be far more people paying no tax than indicated in the diagram below. The top marginal tax rate for taxable income over $180,000 is 46.5%, the same in both reporting periods.

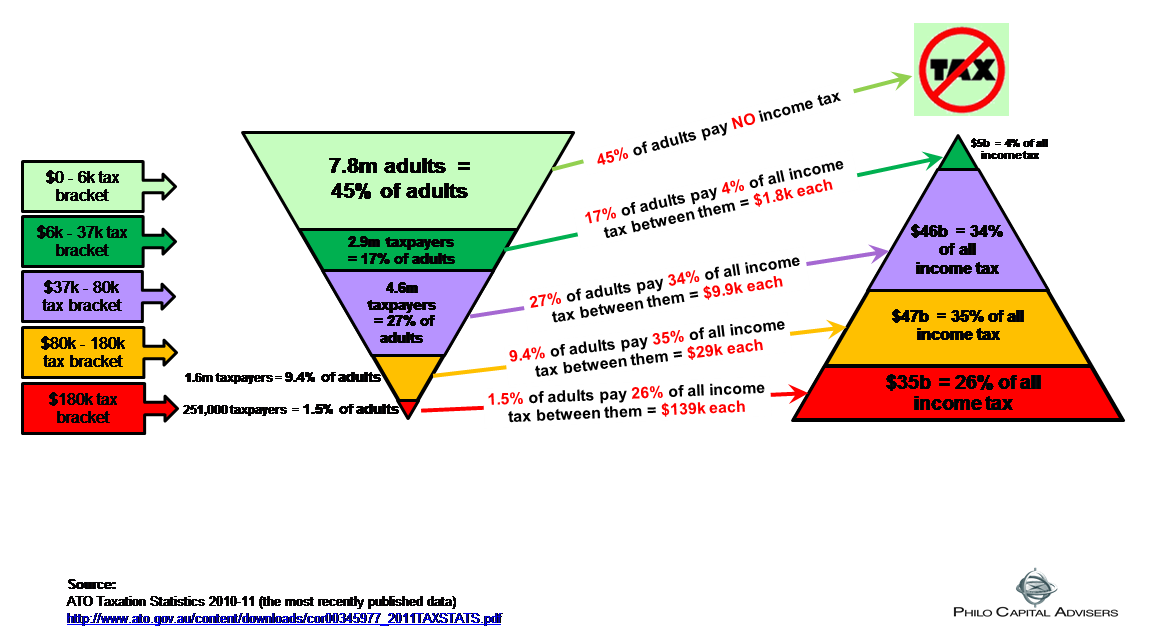
The following graph illustrates the amount of tax paid by tax bracket as at 2010/2011, and perhaps the most surprising statistic is the number of people in the bottom category who pay no personal income tax, even when the cut off was $6,000:

  • 45% of all adults, almost 8 million, pay no personal income tax. Another 17% or 3 million pay an average of $1,800. Therefore, 62% of Australians pay 4% of total personal income tax revenue
  • 26% of personal income tax, worth $35 billion or an average of $139,000 each, is paid by the 1.5% of adults or 260,000 people who earn more than $180,000
  • in the middle, 44% of adults or 7.5 million, pay the balance, 69% of income tax.


Ashley Owen is Joint Chief Executive Officer of Philo Capital Advisers and a director of Third Link Investment Managers.


  •   7 June 2013
  • 2
  •      
  •   
2 Comments
Kevin Chuah
June 09, 2013

Hi Ashley,

As a statistician, I was also surprised by your findings presented here. In order to better understand your findings, I attempted to reconcile the data that you have presented. However, after looking at the source you quote from, I now realise that the data you have presented is not the data actually published by the ATO. Rather you seem to have re-interpreted what the ATO has published in Table 2.13 in the source you quote in the diagram. (Please correct me if I am wrong.)

This table shows that there were a total of around 9.3mn income tax payers in Australia in the 2010-11 income year. Of that 9.3mn, 2.7% have a taxable income of $180,000 or more, accounting for 26.2% of the income tax raised. You have then assumed that there is around 17mn “adults” in Australia, hence your 1.5% figure above.

In a similar way, you have assumed that any of the 17mn “adults” that do appear in this table pay no income tax and as a result, almost 8mn or 45% of “adults” pay no income tax. Importantly, what you have assumed to be “adults” seems to include anyone of “working age” or above.

Taking the latest data from the ABS, we can see that 66% of the Australian population was of "working age" (ie between 15-64). Further, 16.4% of the population where aged 65 or over. This means that roughly 20% of "adults" were eligible for retirement and far less likely to pay income tax. Additionally, a meaningful proportion of those in the bottom-end of the working age population could be expected to be in full-time education, so would also be unlikely to earn enough to pay income tax.

If you adjust your data for the working age population, the statistics look far less alarming. In fact, your 45% figure above would become 31%. One then needs to consider how many young people are in full-time education and how many households have one adult member staying at home. Once you consider that, I'm sure your figures look far less extreme and much less surprising.

ashley owen
June 10, 2013

Kevin, thanks for the feedback. It's all a question of definition. I start with a simple, everyday definition of adults - people over 18 years of age - ie all those entitled (forced actually) to vote - all those who enjoy the privileges of living in this great country - with clean air, safe water, safe food, safe streets, rule of law, protection of property rights, public institutions, national security, etc, etc. It is not an issue of equity, morality, inaliable human rights to welfare, etc - it is a simple fact that all of this must be paid for. One could argue that all people receiving income - of whatever type, whether of "working age" (whatever that is) or not - enjoy the benefits of this great country and ought to contribute financially in some small token way as a proportion of that income, however small that is. On the other hand if you narrow the definition down to those adults who are liable to pay tax after all of the tax breaks, rebates, subsidies, supplements, tax-free pensions, negative income tax transfers, income-splitting and other paper shuffling tricks - then of course close to 100% of people required to pay tax actually pay tax.
cheers.


Leave a Comment:

RELATED ARTICLES

Taxation reform: is Canberra serious?

FactCheck: Is 50% of all income tax paid by 10% of the working population?

banner

Most viewed in recent weeks

How cutting the CGT discount could help rebalance housing market

A more rational taxation system that supports home ownership but discourages asset speculation could provide greater financial support to first home buyers.

3 ways to fix Australia’s affordability crisis

Our cost-of-living pressures go beyond the RBA: surging house prices, excessive migration, and expanding government programs, including the NDIS, are fuelling inflation, demanding bold, structural solutions.

Making sense of record high markets as the world catches fire

The post-World War Two economic system is unravelling, leading to huge shifts in currency, bond and commodity markets, yet stocks seem oblivious to the chaos. This looks to history as a guide for what’s next.

Is there a better way to reform the CGT discount?

The capital gains tax discount is under review, but debate should go beyond its size. Its original purpose, design flaws and distortions suggest Australia could adopt a better, more targeted approach.

Welcome to Firstlinks Edition 648 with weekend update

This is my last edition as Editor of Firstlinks. I’m moving onto a new role though the newsletter will remain in good hands until my permanent replacement is found.

  • 5 February 2026

It’s economic reality, not fear-based momentum, driving gold higher

Most commentary on gold's recent record highs focus on it being the product of fear or speculative momentum. That's ignoring the deeper structural drivers at play. 

Latest Updates

Superannuation

Super is catching up, but ageing is a triple-threat

An ageing Australia is shifting the superannuation system’s focus from accumulation to the lifecycle of retirement. While these pressures have been anticipated for decades, they are now converging at scale and driving widespread industry change.

Investment strategies

Corporate earnings show resilience against volatility but risks remain

Evidence for a strong reporting season had been piling up for months and validated an upgrade cycle already underway. However, risks remain from policy uncertainty.

Superannuation

Want your loved ones to inherit your super? You can’t afford to skip this one step

One in five Australians die before retirement and most have not set up their super properly so their loved ones can benefit from all their hard work and savings. 

SMSF strategies

Sixteen steps in a typical SMSF borrowing

Getting a mortgage is never an easy process but when an investment property is purchased in a SMSF the complexity increases significantly. Read this before taking the plunge. 

Planning

Do HNWI get better advice?

Good advisers lead to more diversification, lower turnover and less home bias. However, studies show the average adviser may not be adding much value to clients. 

Strategy

AFL Final Ten with wildcard edit 'unlevels' the field

When the new AFL season kicks off a wild-card will be added to the finals. Is this new formula fair and how does it impact the odds of winning the premiership.

Planning

Love them or hate them, it's worth understanding annuities

Investors have historically balked at exchanging a lump sum for a future steam of income. Breaking down the financial and emotional considerations of purchasing an annuity.        

Sponsors

Alliances

© 2026 Morningstar, Inc. All rights reserved.

Disclaimer
The data, research and opinions provided here are for information purposes; are not an offer to buy or sell a security; and are not warranted to be correct, complete or accurate. Morningstar, its affiliates, and third-party content providers are not responsible for any investment decisions, damages or losses resulting from, or related to, the data and analyses or their use. To the extent any content is general advice, it has been prepared for clients of Morningstar Australasia Pty Ltd (ABN: 95 090 665 544, AFSL: 240892), without reference to your financial objectives, situation or needs. For more information refer to our Financial Services Guide. You should consider the advice in light of these matters and if applicable, the relevant Product Disclosure Statement before making any decision to invest. Past performance does not necessarily indicate a financial product’s future performance. To obtain advice tailored to your situation, contact a professional financial adviser. Articles are current as at date of publication.
This website contains information and opinions provided by third parties. Inclusion of this information does not necessarily represent Morningstar’s positions, strategies or opinions and should not be considered an endorsement by Morningstar.