The lists of Australia’s wealthiest individuals and families published annually by different media organisations are generally an interesting read.
Ranking them by their net wealth, they show that many of the richest Australians have progressively become richer over time through a combination of business expansion, market forces and shrewd investment decisions.
In fact, looking at the aggregate data compiled over the last five years alone, the estimated combined wealth of the top 200 wealthiest people in Australia has jumped by around 50% to over $670 billion.
Australia’s top ranks include individuals involved in resources, property, information technology, and investing. One could describe them as a diversified group of investors.
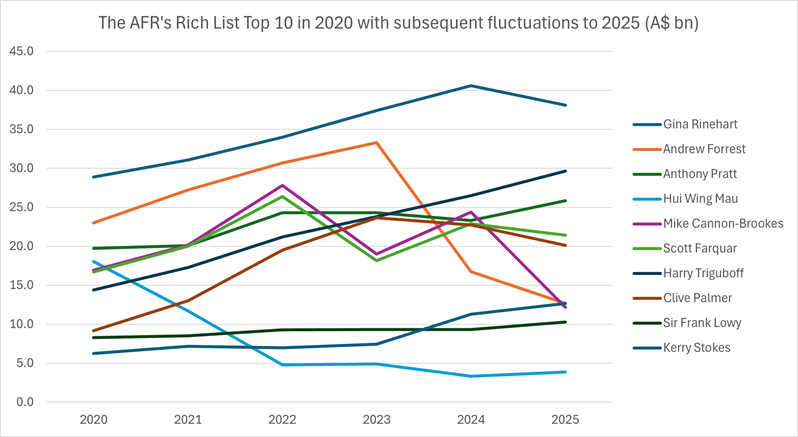
Yet, the real story behind the rich list rankings only becomes apparent when one digs a little deeper and compares how individual fortunes have changed from year to year.
The overall numbers have continued to increase, but the wealth gains by individuals have certainly not been uniform over time. In fact, among the top rankings, individual wealth levels have tended to shift up and down by billions of dollars from year to year.
Some individuals and families have managed to increase their fortunes every year, without fail. But others, because of unfavourable market conditions, poor investment decisions or a combination of both, have suffered losses over the same time and slipped down the overall rankings. Some have even fallen off the rich list entirely.

Source: Wikipedia, Financial Review Rich List [https://en.wikipedia.org/wiki/Financial_Review_Rich_List]
With the benefit of hindsight, those people may have chosen to do things differently.
Following a managed investment strategy
For example, as contrarian as it may sound, had the latter cohort – those who have slipped down or off the wealth rankings entirely – simply adhered to a managed investment strategy over the last five years instead of pursuing their business interests, their net worth now may actually be higher than it was in May 2020.
And the numbers supporting this strategy are even more compelling over longer periods of time, thanks to the compounding growth on global share markets.
To illustrate this point, let’s compare the unit price returns over five years of three different Vanguard equities-based exchange traded funds (ETFs) based on an initial $10,000 investment back in April 2020.
They are the Vanguard Australian Shares Index ETF (VAS), the Vanguard MSCI Index International Shares ETF (VGS), and the Vanguard U.S. Total Market Shares Index ETF (VTS).
These particular ETFs have been chosen for illustrative purposes only because each closely tracks the broad performances of share markets in different parts of the world.
Here are the results, with the table below showing what a $10,000 investment made in May 2020 , during the early days of the COVID-19 pandemic, would have been worth on the Australian Securities Exchange (ASX) at 31 May 2025.
This data is based on each fund’s month-end net asset value (NAV), which is the value of its investments divided by the number of units in the fund. NAV movements give a good indicator of the historical performance of a fund, but they won't exactly match the returns you see as an investor. That's because your performance experience is based on the buy price (the price at which you buy into a fund) and the sell price (the price at which you sell).
The unit price returns exclude income distributions that were received by investors over the period.

Staying the course
What the numbers demonstrate is that, over the last five years, many investors using broad-based index funds that invest in different equities markets would have been well ahead by now, even without making any additional investments along the way.
Inputting higher initial deposit numbers, making regular investments in the same ETFs, and the reinvestment of distributions would obviously have produced even more impressive total returns.
And keep in mind that the last five years has included significant volatility following COVID and during the more recent economic, geopolitical and trade events.
The Vanguard Index Chart provides a much longer perspective over the last 30 years, showing the growth of different investment classes and how a starting balance of $10,000 would have changed in value after being invested into each asset class.
It’s a valuable lesson that at least some Australian rich listers have taken on board. In addition to expanding their business interests, it has been reported certain individuals have been investing heavily into ASX-listed and foreign-listed ETFs.
One could say they are hedging their investment bets.
Tony Kaye is a Senior Personal Finance writer at Vanguard Australia, a sponsor of Firstlinks. This article is for general information purposes only and does not consider the investment objectives, financial situation or needs of any individual.
For more articles and papers from Vanguard Investments Australia, please click here.